Makeover Monday: Economic value of the bicycle industry
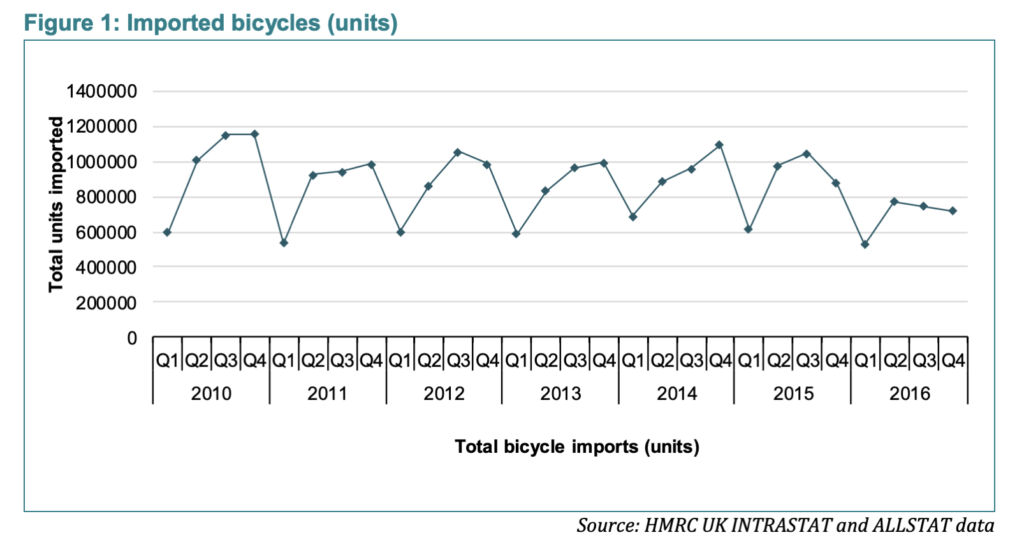
Original
Analysis of the original
Here are a series of questions I use to analyse a chart.
- Where are my eyes drawn?: At first sight my eyes are drawn to the crowded x-axis.
- What works in this visual?: It’s a simple line graph and conveys how the bicycle imports increase and decrease through the year. The Y-axis is labelled well.
- Identify clutter, make note of anything you find confusing: The X-axis label is confusing. The X-axis text and tick marks separating quarters and years are very dark. The Y-axis numbers could be simplified to millions.
- Is the take-away action clear? The bicycle imports go through a cyclic decrease in Q1 and it increases as we get to Q4 every year. 2016 is lower compared to other years but this message is not immediately clear. Also, it is not clear that 2016 had lesser imports per quarter than most years.
- Are pre attentive attributes used to draw user’s attention? No, there are no pre attentive attributes used in this chart.
Makeover
Sometimes we need more than one chart to communicate our message. This makeover is a good example of how one chart may be inadequate to convey the whole story.
There are 2 stories here:
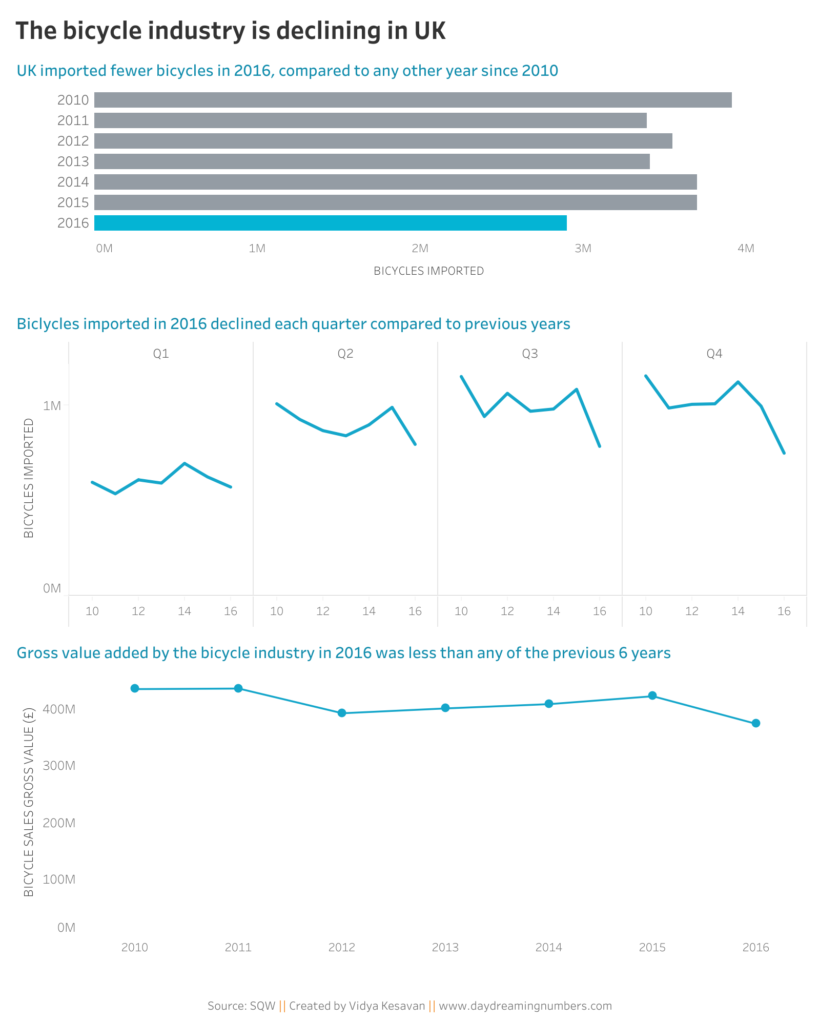
- In 2016 UK had the least number of bicycle imports compared to the last 6 years.
- In 2016 UK had the least number of bicycle imports per quarter (except Q1) compared to last 6 years.
The first story uses yearly bicycle imports data. The second story uses the parts – quarterly import data. The original chart tries to communicate both these messages using a single chart. The problem with the original is that we see the quarter to quarter variation, but not the yearly variation.
Hence this makeover uses 2 charts, one for yearly data and one for quarterly trend.
In addition, I decided to show a trend of the Gross value added by the bicycle industry. This gives a view of the financial implication of the decline in bicycle imports.
So here is the makeover.
If you would like to try your own makeover, here is the data.