#SWDChallenge: a makeover
The #SWDChallenge this month is a makeover project. The challenge instructions come with a wonderful article by Elizabeth Ricks of SWD on the art of undertaking chart makeovers. I found the article very insightful and I took a lot of notes.
In a nutshell, here are a few steps to get started with doing “good chart makeovers”.
- Start by noticing where your eyes are drawn first: What do you pay attention to in the graph? What works well in the existing visual? The answers to these provide a starting point for how we want to approach the makeover.
- Identify clutter, make note of anything you find confusing: Is the chart too complicated to make sense of? Do you identify any clutter? These notes provide us with pointers for what we want to improve in the chart.
- Consider how you might chart the data differently: What other chart types would you use that would allow you to see things that you might not have otherwise seen?
- Evaluate if the takeaway and/or the intended call to action is clear: Does the chart have a takeaway message? If yes, is the takeaway message clear. If there is no takeaway message, can you add one? Does the chart use pre-attentive attributes wisely to draw attention to the takeaway message? Does the chart have a call to action?
- Be nice: Last but not the least, it is important to be nice in our critique. We do not know the constraints faced by the chart creator. Do not criticise the chart creators skills. Provide feedback on what can be improved and explain how it improves the chart.
Now to the makeover!
The Original Chart
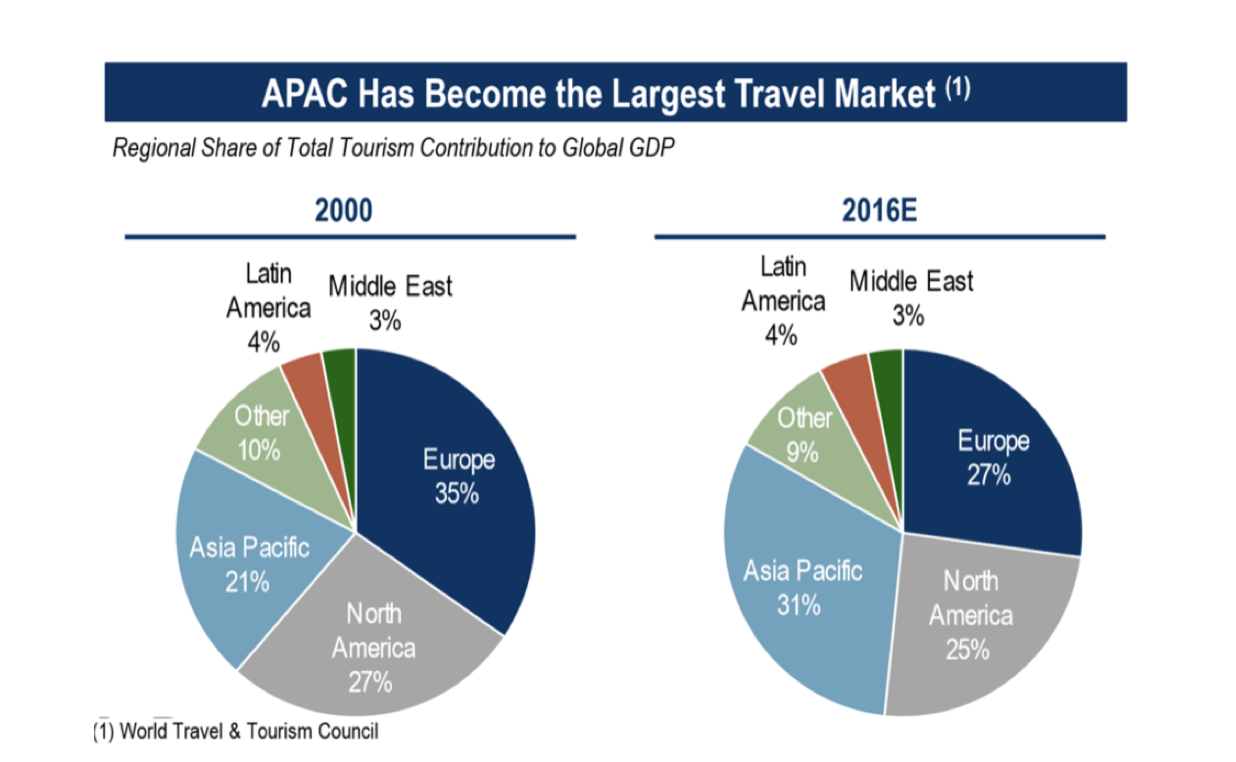
This is the original chart and the data for the challenge.
What do I observe from this chart?
What are your eyes drawn to?
My eyes are drawn to the pies representing Europe and the title. The deep blue colour stands out in this chart.
What works well?
The growth in Asia Pacific tourism seems to be the story.
The heading is clear and draws my attention.
The part to whole relationship is clear with the use of pie charts.
Identify clutter and make notes of anything that seems confusing or complicated
Pie charts are not optimal for comparison. To compare the values between 2000 and 2016, we have to rely on the data labels darting our eyes back and forth.
The data labels also make the chart cluttered.
Using colour to code every region is adding to cognitive load because we now have to make note of the colour when comparing values.
The year 2016 seems to be an expected value, but the title suggests otherwise. That’s confusing.
Does a different graph type allow you to see things that you might not have otherwise seen?
A bar chart will allow us to compare the values for 2000 and 2016 for each region efficiently. But what we won’t see though is the position of regions for each of these years.
A slopegraph will allow us to see the trend for each region with ease. Their positions for these years will also become very clear.
Evaluate the takeaway and intended call to action
The takeaway message here is that Asia Pacific is the largest travel market. The title of the chart makes this clear, In the graph though, Asia Pacific is lost in the sea of colours. There is no real call to action in this chart.
The Makeover
I started with a clustered bar chart.
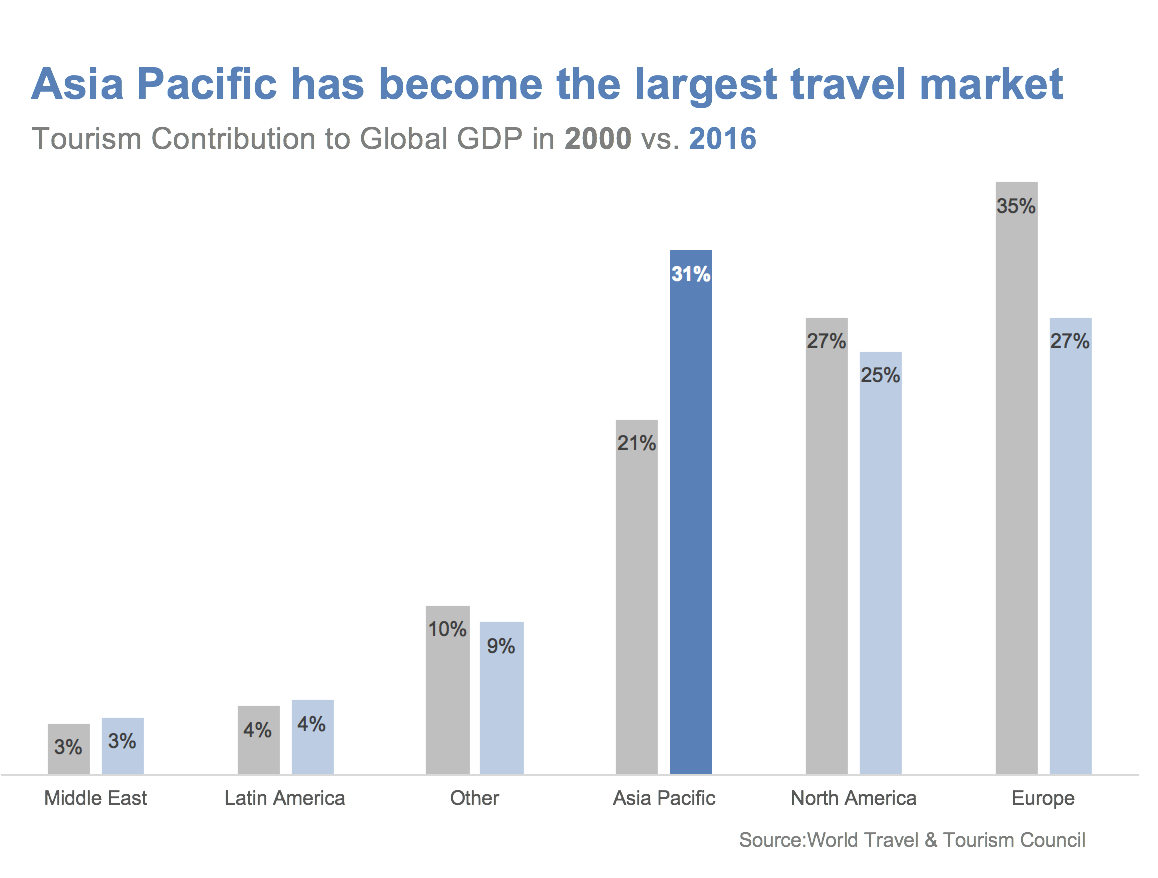
The clustered bar chart makes comparisons between regions easy. But the trend for a year, say 2000 is lost. The part to whole relationship is also lost. I decided, this is not a great makeover.
Moving on, I tried a slopegraph.
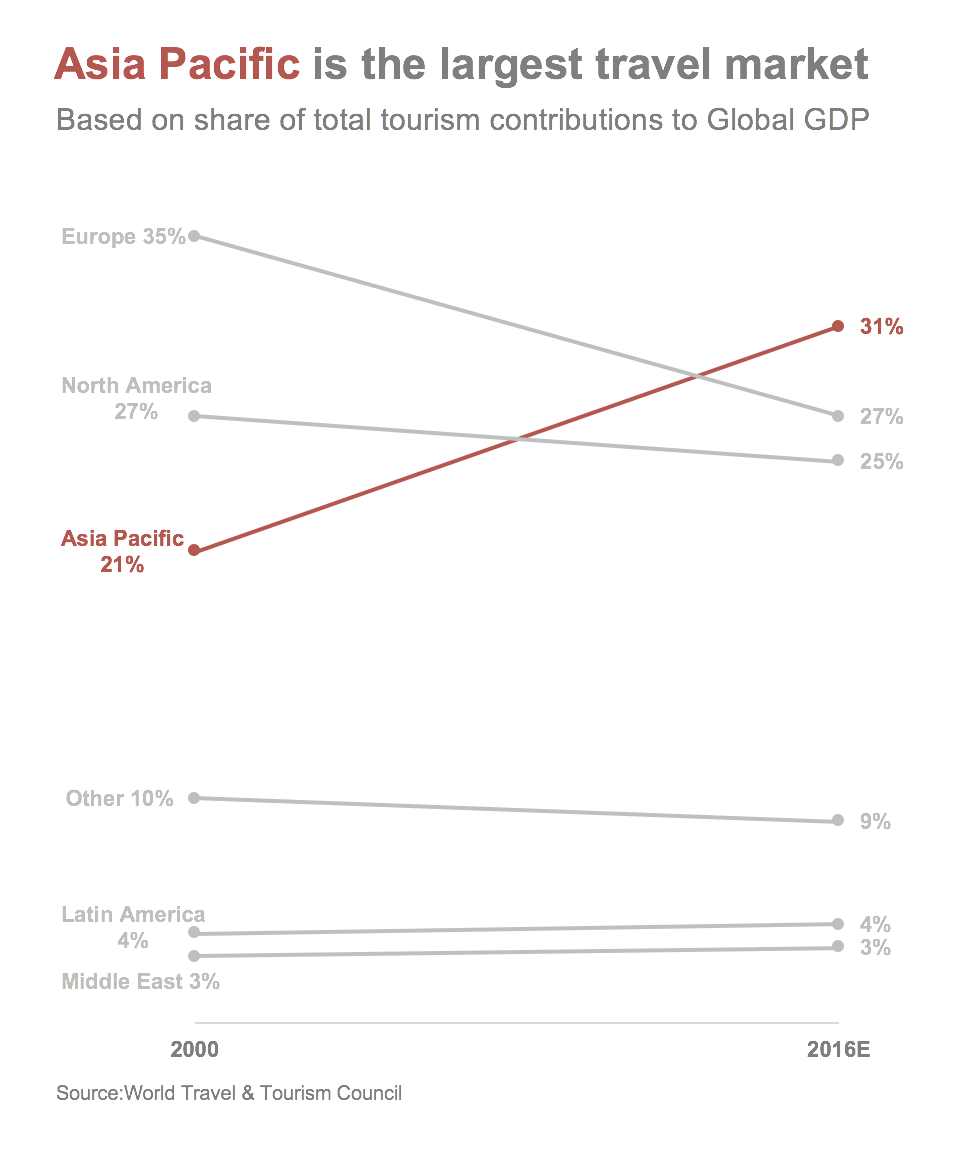
Immediately our eyes are drawn to the Asia Pacific line. The growth is the hero of the story told by this chart. Then we look at Europe and North America.
The slopegraph shows the trend very clearly but it doesn’t make it clear that Asia Pacific ate into Europe and North America’s share. The part to whole relationship is lost in a slopegraph. That’s fine because a slopegraph is not meant to show part to whole relationship.
I was happy with the slopegraph, but I wanted to see if I can include the part to whole relationship because that seemed like an important part of this chart’s message. The share of Asia Pacific in tourism contribution to Global GDP seemed central to the message.
Hence, I created a back to back bar chart.
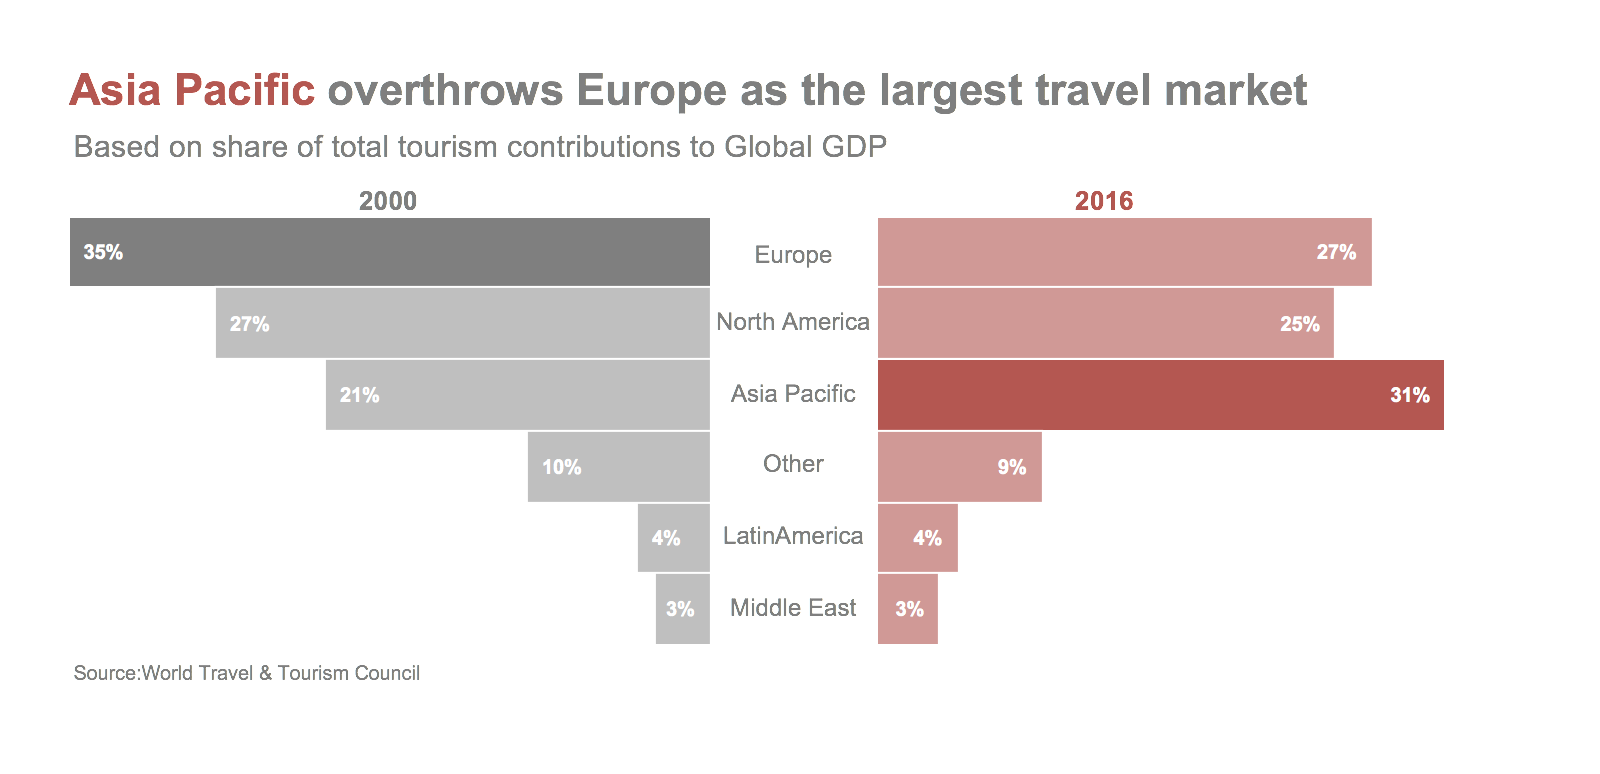
My eyes are drawn to Asia Pacific in the title and then immediately to the bar chart on the right where I notice Asia Pacific.
The back to back bar charts make the comparison between regions for a year as well as comparison between years for a region very easy.
The bar lengths make it evident who the largest contributors for each year are.
We see the part to whole relationship now.
The slopegraph and the back to back bar charts both do a great job of communicating the key message. The only question is what is the key message?
- Asia Pacific travel market has grown significantly between 2000 and 2016 : Slopegraph
- Asia Pacific is the largest travel market in 2016: Back to back bar chart
- Asia Pacific has the largest share of travel market in 2016: Back to back bar chart
- Asia Pacific travel market has increased, Europe and North America have decreased : Slopegraph
I decided to go with the key message: Asia Pacific has the largest share of travel market in 2016. The growth in Asia Pacific travel market from 2000 to 2016 is my secondary message. And that’s why I decided to go with the back to back bar chart.
Here is the image of the original and the makeover.