When marrying in Hawaii, buy a Japanese car: Indexed charts explained
What is Indexing?
Indexing refers to modifying two or more data series to start at a common point and change at the same rate as the unmodified series.
In this article, we will learn how to index data and use indexed charts.
What are Indexed charts?
Indexed charts tell us how 2 variables changed over time even if they are vastly different or of different magnitudes.
Indexing to compare Marriage rates in Hawaii and Sales of Japanese cars in the US
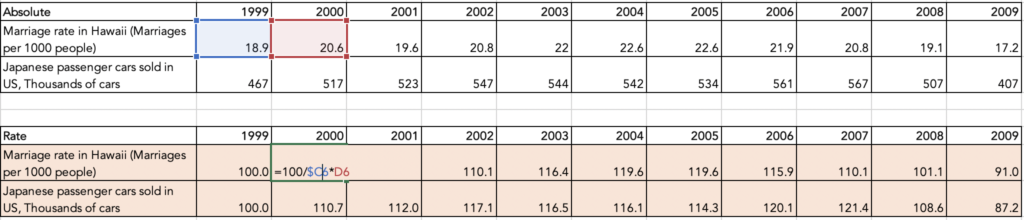
For example, let’s look at this data from Spurious Correlations about marriage rates in Hawaii vs Sales of Japanese cars in the US.

Marriage rates in Hawaii are in marriages per thousand people, Sales of Japanese cars are in thousands of cars. How do we compare these 2 variables?
A simple way to make such comparisons is to index data to start at the same point. In indexing, variables are set equal to each other and then examined over time for differences.
Let’s see how to do this.
Step 1 – We set the same starting point for the data. This could be any number but for simplicity let’s use 100.
Step 2 – We calculate the rate of change of the variable. The rate is calculated as 100/Xt * X0
Where Xt is the value for the time period– 2000, 2001 etc.
X0 is the value in the initial time period.
Plotting as a line chart, this is what the indexed chart looks like.
As you can see, indexed charts make the comparison of vastly different data very easy.
Indexing to compare data of different magnitudes
Indexing is also helpful to compare data of different magnitudes. Say we want to compare the GDP of a country (India) to the Global GDP.
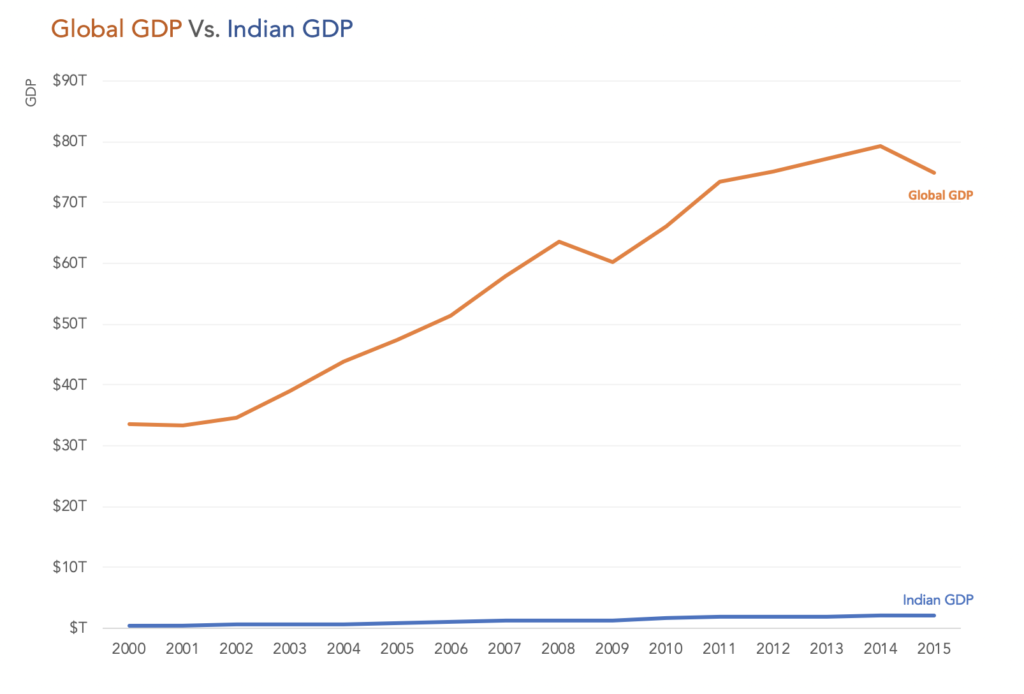
Indian GDP and Global GDP are at vastly different magnitudes. Looking at this chart it is not clear if the Indian GDP grew faster or slower compared to Global GDP.
Now let’s plot the indexed data.
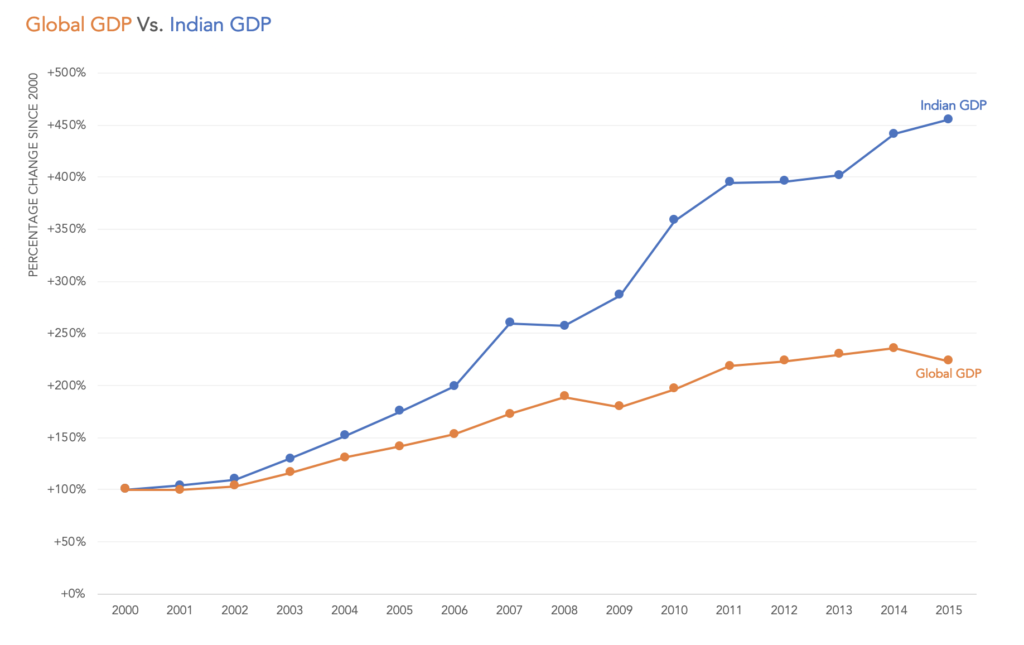
This chart shows the effect of indexing the data series. From 2009 to 2015, the Indian GDP grew much faster than the Global GDP.
Indexing data is an effective method to normalize the data to a common starting point and observe how variables change over time relative to each other.
Indexing works for more than 2 data series too.
What to keep in mind when using indexed data?
Data series need to have a similar rate of change. For example, if one changes by +10000% and the other by +5%, it is hard to view them on the same chart.
In indexing, we lose absolute numbers and hence a sense of scale. The Indian and Global GDPs are vastly different in magnitude, but that information is lost on indexing. One way to overcome this is to add numbers to the chart directly to provide a sense of scale.