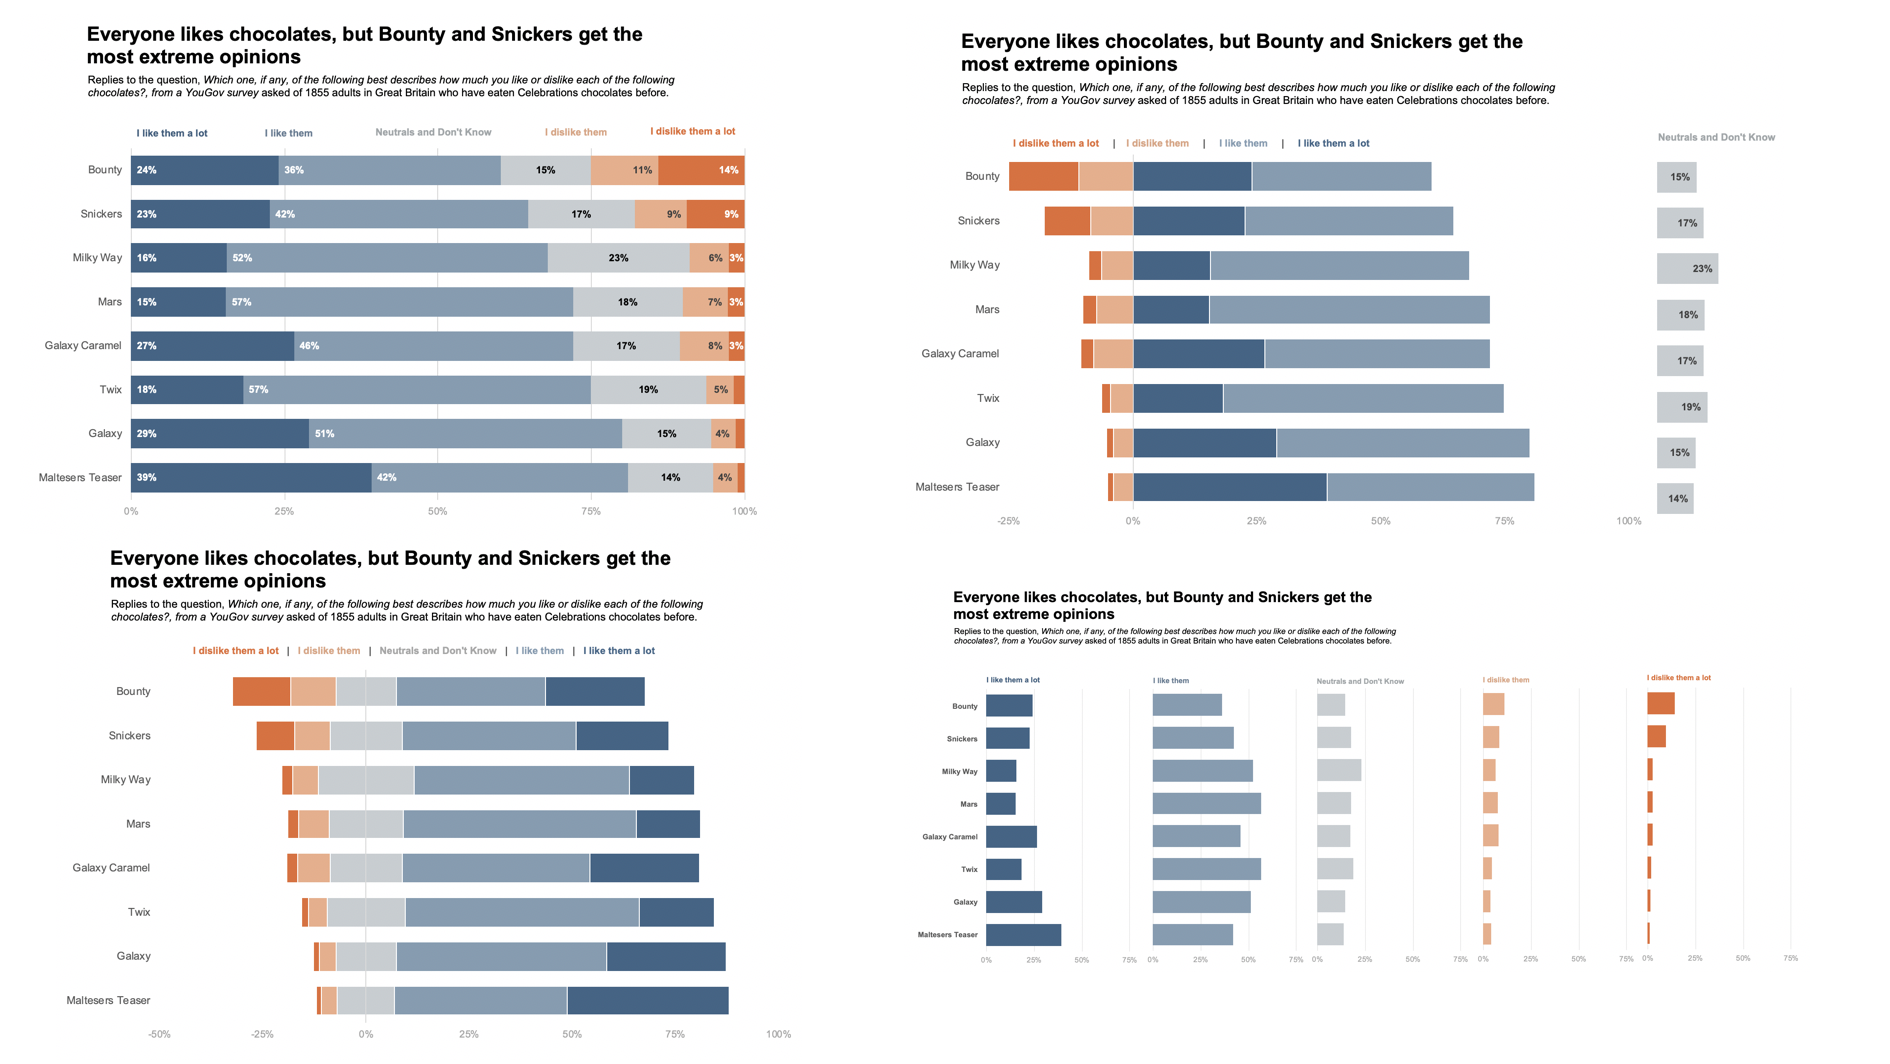
4 ways to visualize Likert Scales

Halloween just went by and it is Diwali this week in India - which means there are a lot of sweets around. I am on a no-sugar diet now, so no candies or sweets for me. To satisfy my sweet tooth, I thought it would be fun to use a candy data set to learn…

10 Comments

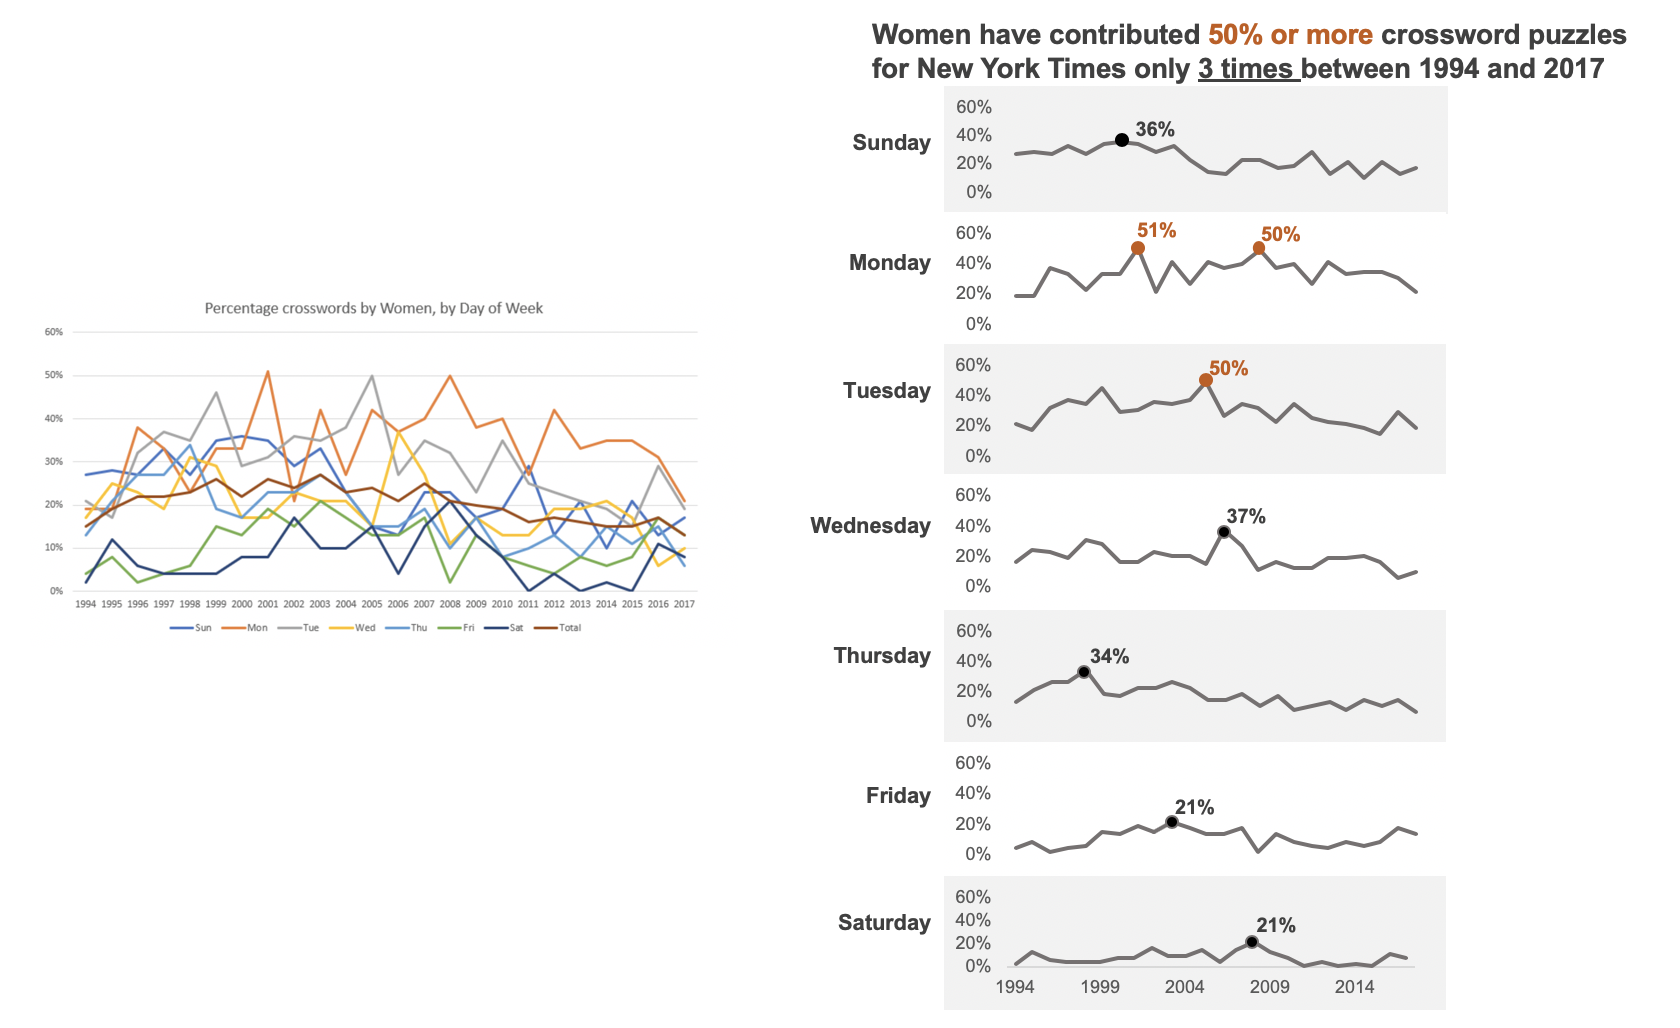
#SWDChallenge: a makeover

The #SWDChallenge this month is a makeover project. The challenge instructions come with a wonderful article by Elizabeth Ricks of SWD on the art of undertaking chart makeovers. I found the article very insightful and I took a lot of notes. In a nutshell, here are a few steps to get started with doing "good…

0 Comments

A Complete Guide to Types of Data and Measurement Scales

Why Data Types and Measurement Scales? Data types are important in data visualization as they determine the visualization method or chart type. In other words, we need to know what type of variable we are dealing with in order to choose the most suitable chart type. Having a good understanding of different types of data…

0 Comments

Gestalt Laws Applied to Data Visualization

Gestalt is German for "Unified Whole". Gestalt psychologists Max Wertheimer, Kurt Koffka and Wolfgang Kohler sought to understand how we humans make sense of what we see from the chaotic stimuli around us. Their findings were that we seek to form patterns, group objects in particular ways and simplify complex images. The main principle of…

2 Comments