#SWDChallenge: visualize THIS data!

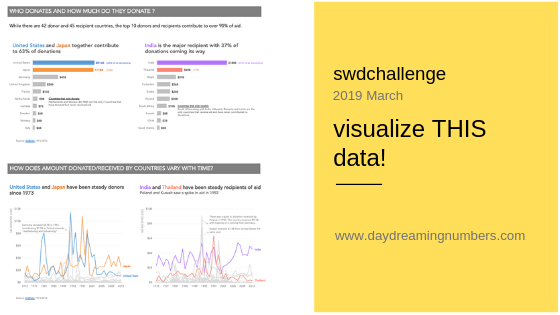
This month’s #SWDChallenge was to visualize a specific dataset and create visualization(s) to answer specific questions. This is different from an open-ended data analysis where we go on looking for interesting stories in the data. Most often in our jobs, we use data visualization to communicate answers to predefined questions – for example, who are…

0 Comments

#SWDChallenge : visualize variance

For this month’s SWDChallenge, Cole challenged us to visualize the variance in data. The mode, the median or the mean may not be a model that represents the entire dataset accurately. Hence it is important to visualize variance.

1 Comment

#SWDchallenge : let’s try something new!

January 2019 SWDchallenge is all about going beyond our comfort zones - to make a visualization using a new tool. I make most of my visualizations using R, Excel or Tableau. For this challenge I decided to try Datawrapper. I am a huge fan of blog posts on Datawrapper. I have never used Datawrapper before,…

1 Comment