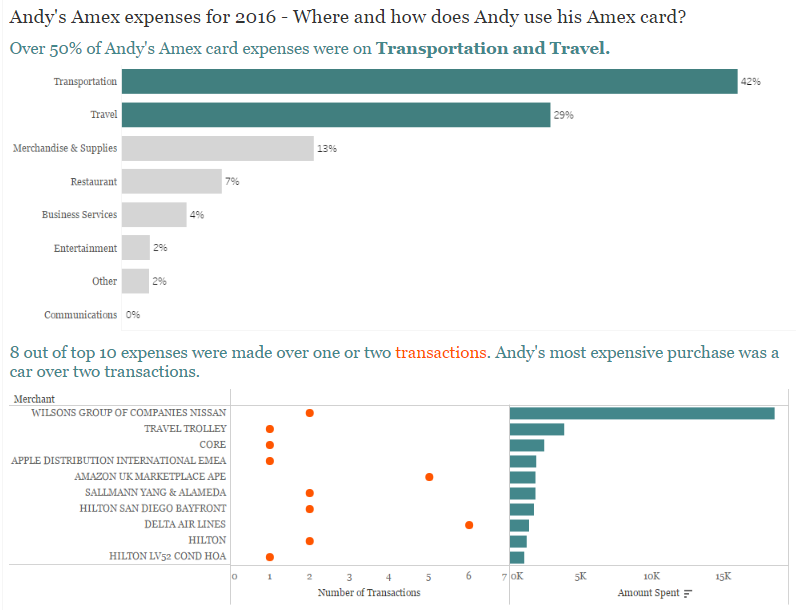
This week’s MakeoverMonday data is on Andy Kriebel’s Amex card transactions for 2016.
My goal with this visualization was to understand and highlight two aspects of Andy’s credit card usage. Where does he spend the most money and what are the nature of the transactions? Does he spend a lot of money at once? Or are there multiple small transactions that dominate the spend?
With the objective established, I set out to create the dashboard.
Click the visual for an interactive version.

