How to add conditional colouring to Scatterplots in Excel
In this tutorial, we will see how to add conditional colouring to scatterplots in Excel. I came across this trick when I was creating scatterplots for an article on Gestalt laws. I wanted the dots on the plot to be in 3 different colours based on which group they belonged to. There isn’t a straightforward way to do this in Excel but with a little data wrangling, its very easy to get this done.
So here is how to do this.
How to add conditional colouring to scatterplots in Excel?
Here is the data we are going to work with. Its a simple table with X and Y values.
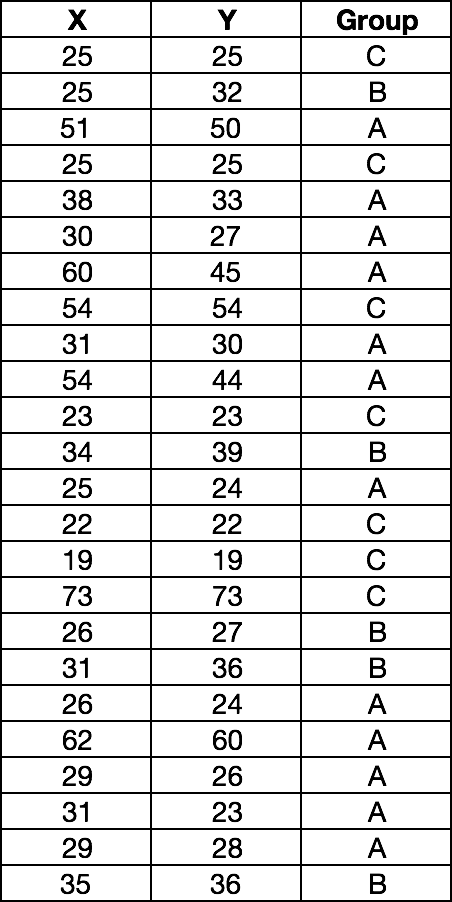
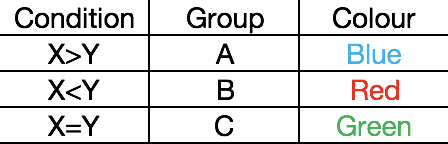
Each data point is assigned a group based on a condition. We want each group to show up in a different colour on our scatterplot.
Step 1: Preparing the data
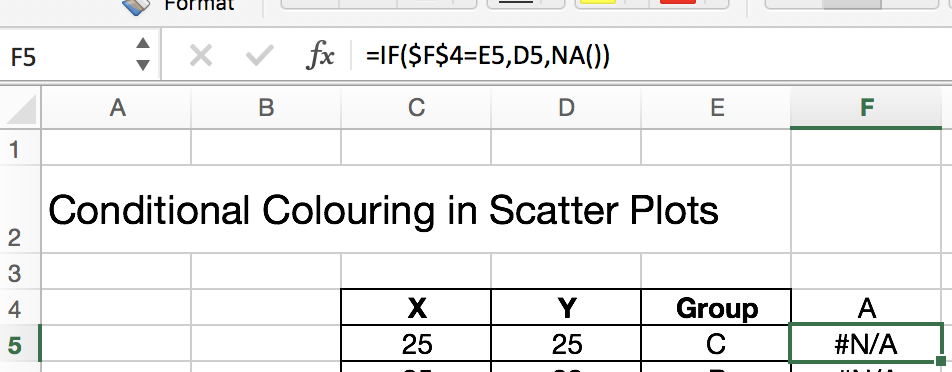
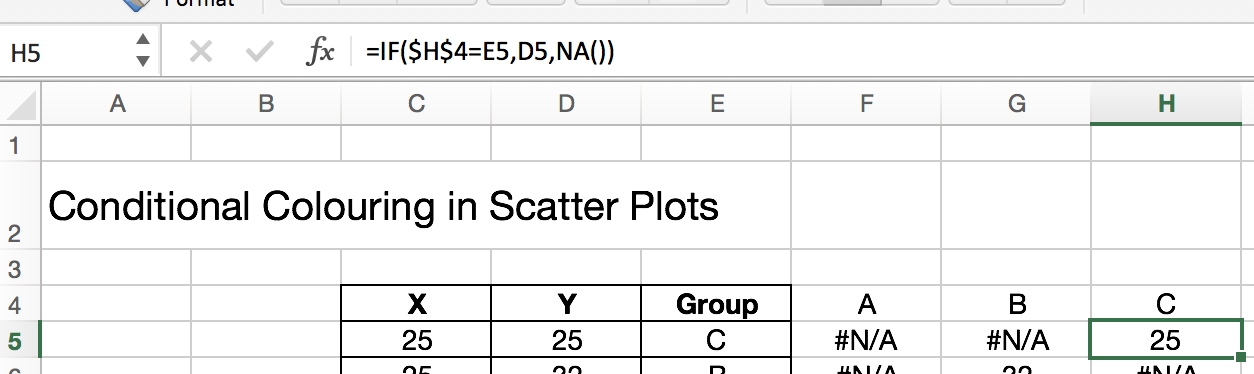
Take the Y column and break it down into 3 columns A, B and C depending on the group the data point belongs to. To do this, we use the excel IF condition:
IF (Condition, Value if True, Value if False)
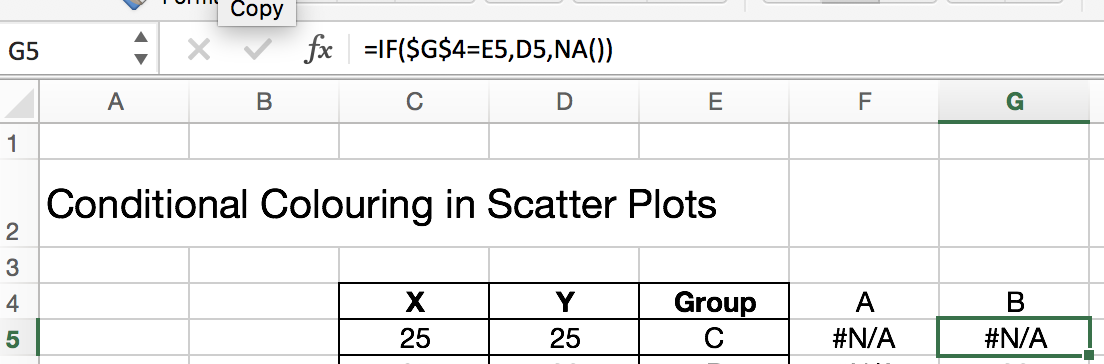
The condition we use is “label of the column = the group name”.For example, for the first data point, in column A, we check if A = C. If the condition is true we populate the column A with the Y value 25. Else we add an NA() to the column. In our example, the value will be NA.
Drag the formula down the A column and repeat the same steps for column B and C
Step 2: Draw the scatterplot
Select Insert and pick an empty scatterplot.
Then select the columns X, A, B,C
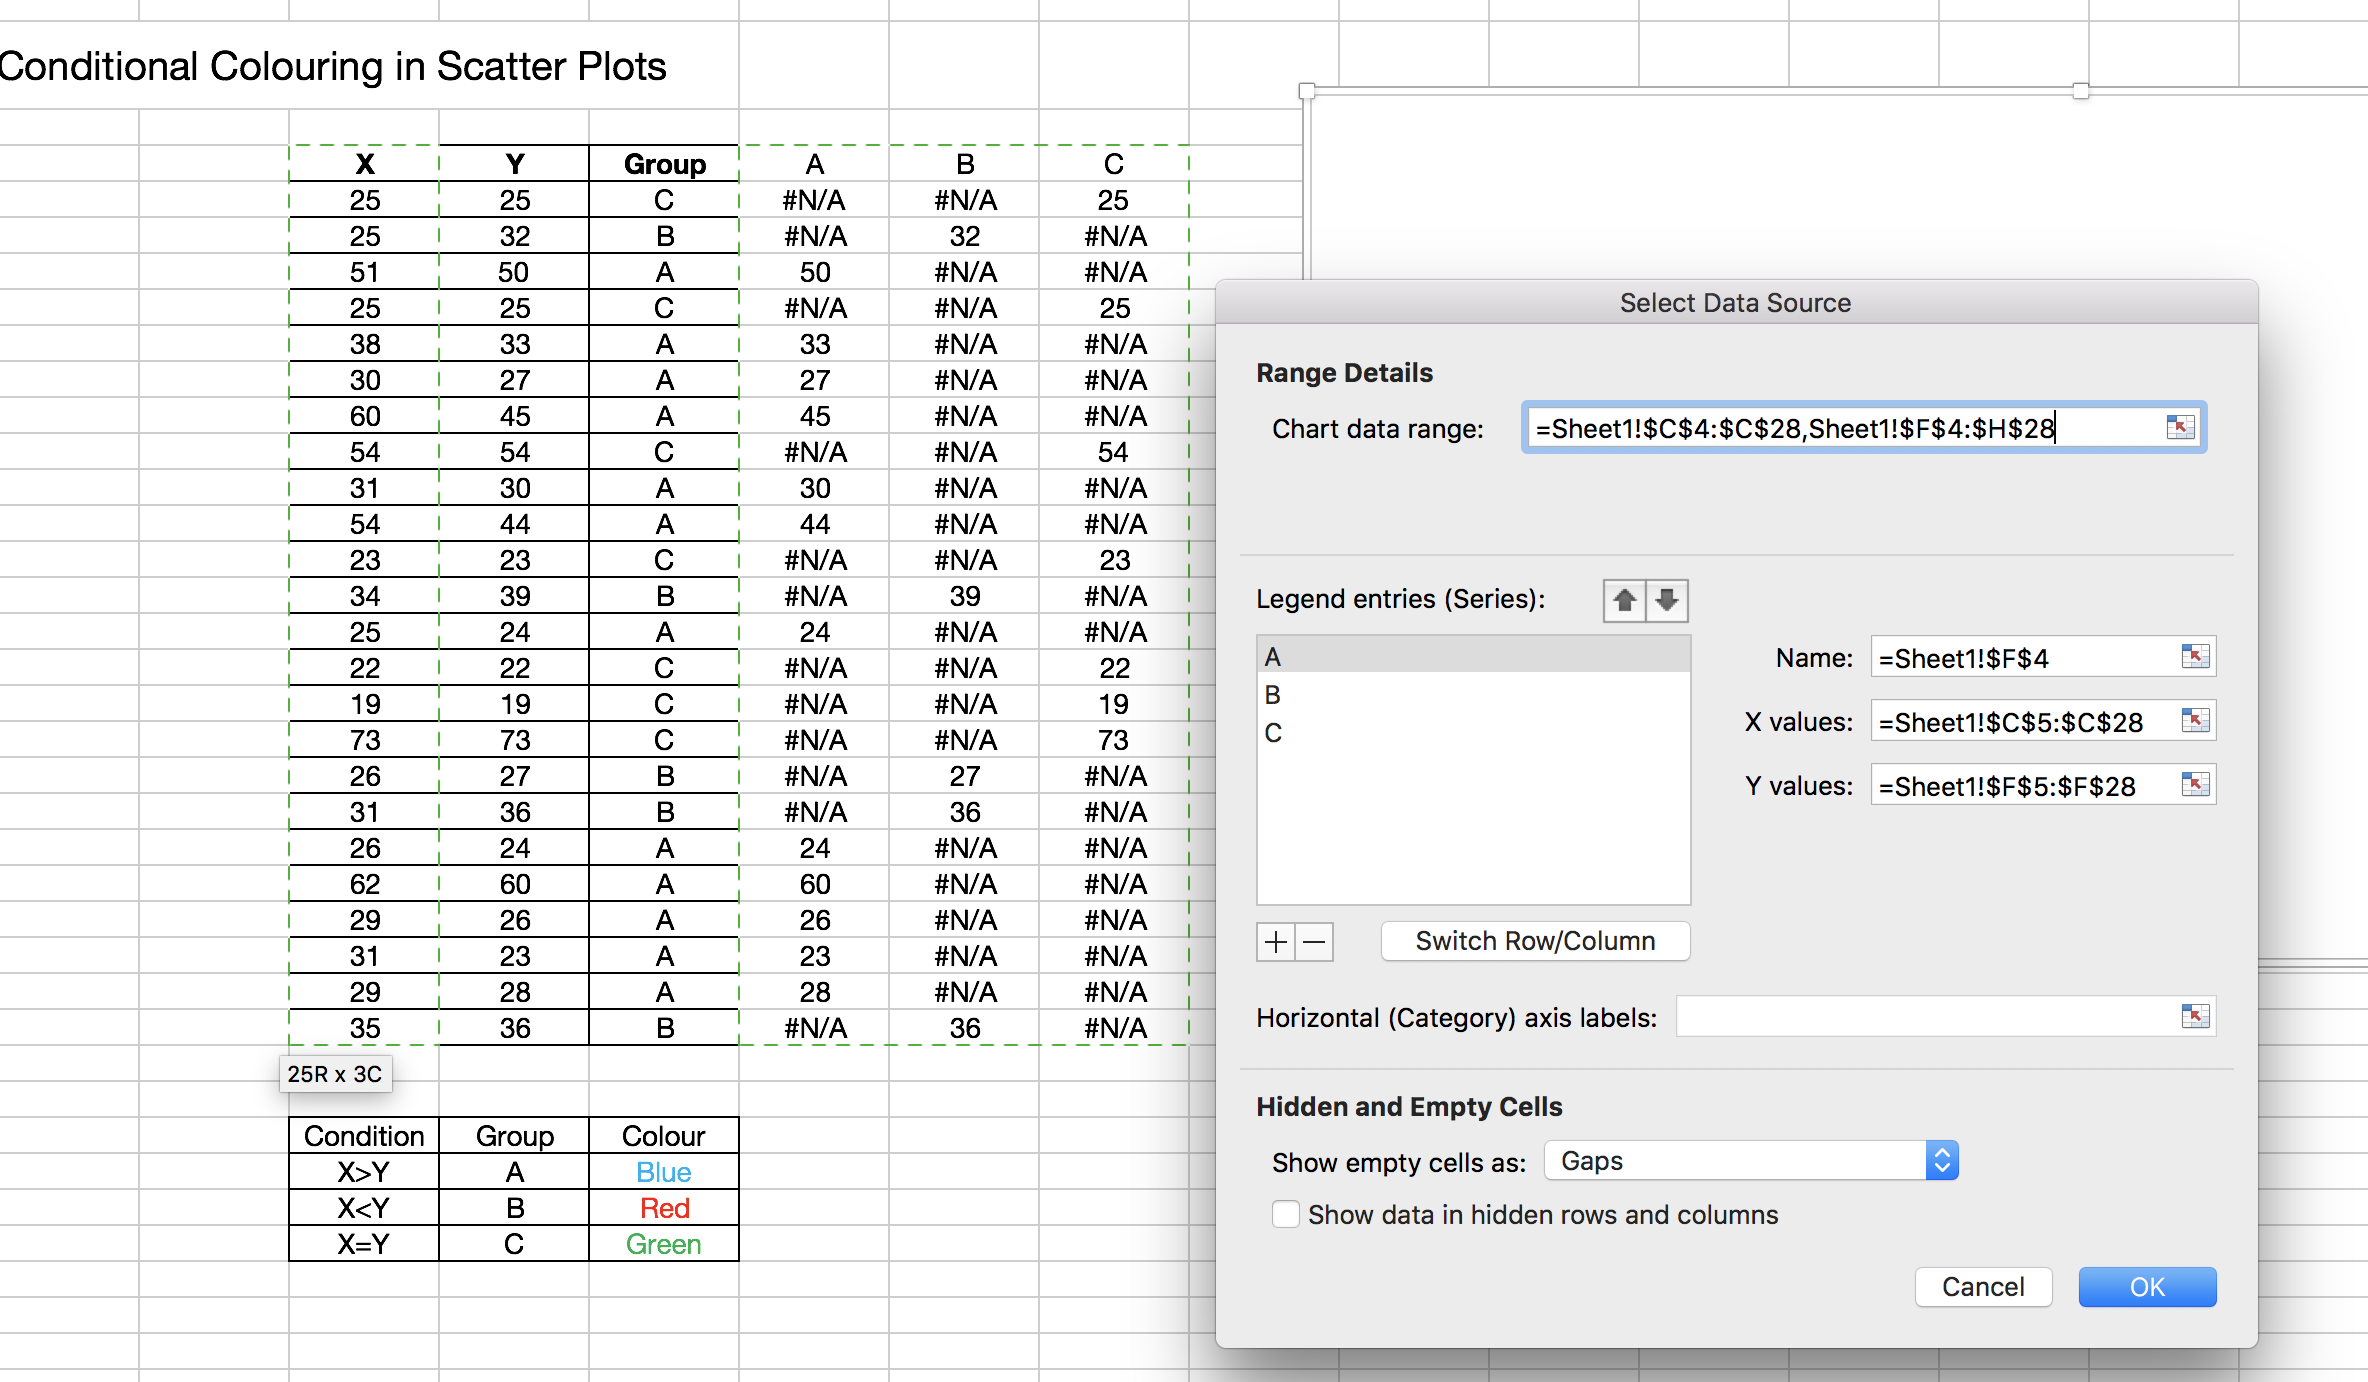
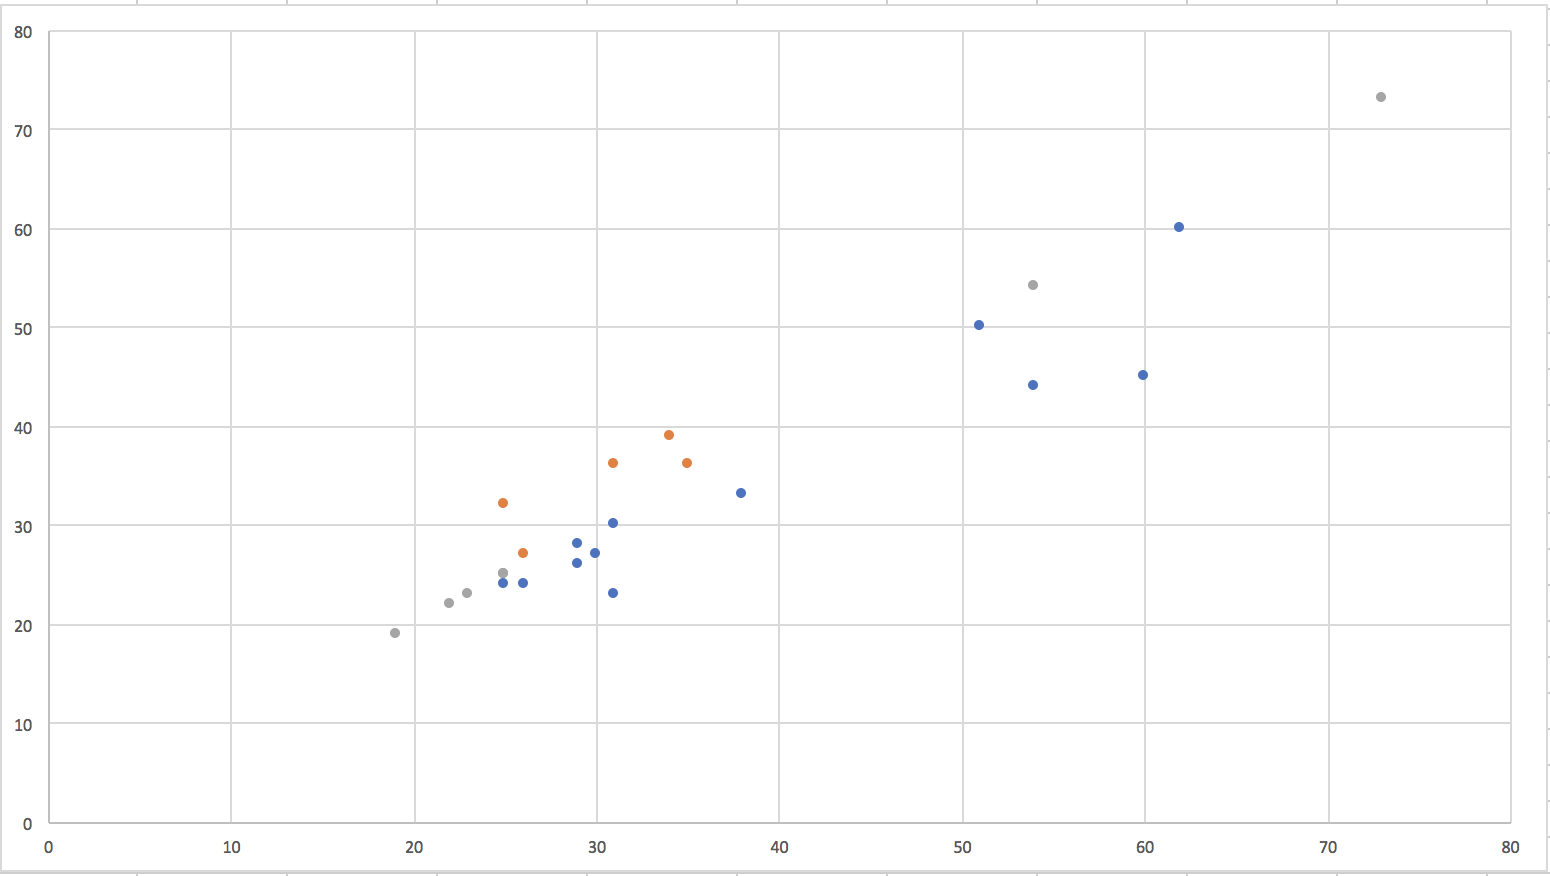
Click OK. Here is the scatterplot with 3 groups in different colours.
Step 3: Edit the colours
To edit the colours, select the chart -> Format -> Select Series A from the drop down on top left.

In the format pane, select the fill and border colours for the marker.
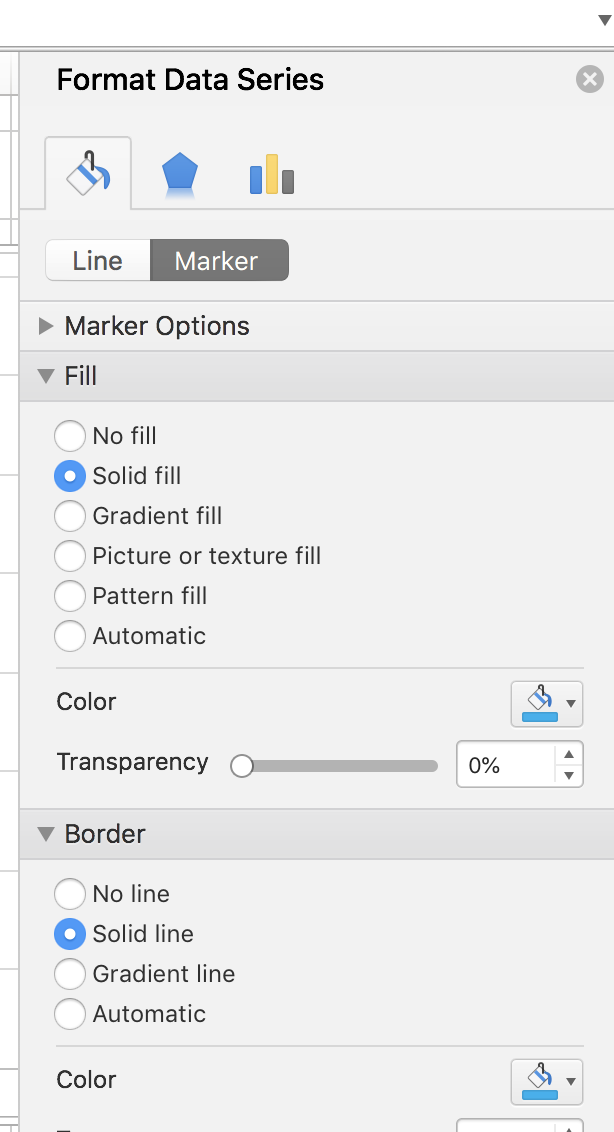
Repeat these steps for Series B and Series C.
Here is our final scatterplot.

Do these steps work for you? If you have any questions or suggestions please let me know in the comments below.


Great post! I’m at a mental block and can’t seem to get past this..
I don’t want the condition of X>Y, X<Y, X=Y.
I want the condition to be if the XY coordinates are in a certain rank (1-5) they will be colored according to their rank.
So instead of having Group A,B,C – I have Rank 1,2,3,4,5 with 5 being the best and 1 being the worst.
What would be the best way to do this?
beautifully done, couldn’t think through how to do it until you called out the idea above.
Amazing tutorial, I was really struggling with it but thanks so you I fully understood the way to Color-code my plots properly
crazy that excel does not have an integrated option for this