The Role of Visual Perception in Data Visualization
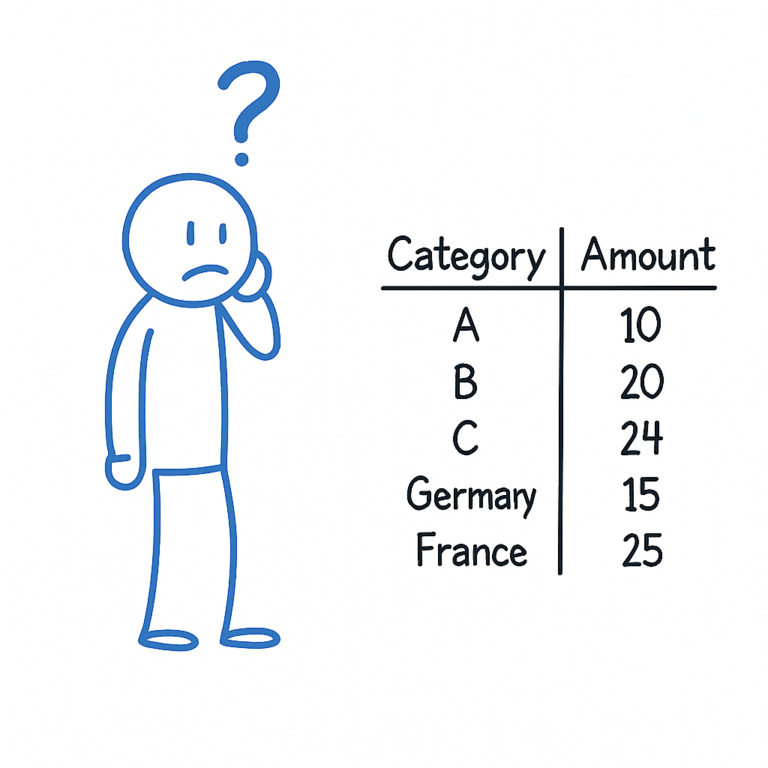
It is said that a picture is worth a thousand words. Why is it that we can understand complex information on a visual but not from rows of tabular data? The answer to this lies in understanding visual perception and a little bit about human memory.
So grab a cup of your favorite drink and read on.
This is what we will cover:
- What is visual perception?
- How does visual perception affect data visualization?
- The power of data visualization
- How human memory works and why is this important to visualization?
What is visual perception?
Wikipedia defines Visual perception as the ability to interpret the surrounding environment by processing information that is contained in visible light. The resulting perception is also known as eyesight, sight, or vision.
How does visual perception affect data visualization?
The main purpose of data visualization is to aid in good decision making. To make good decisions, we need to be able to understand trends, patterns, and relationships from a visual. This is also known as drawing insights from data. Now here is the tricky part, we don’t see images with our eyes; we see them with our brains. The experience of visual perception is in fact what goes on inside our brains when we see a visual.
Let’s understand a little bit more about visual perception. There are 3 key points to note:
- Visual perception is selective. As you can imagine, if we tune our awareness to everything, we will be very soon overwhelmed. So we selectively pay attention to things that catch our attention.
- Our eyes are drawn to familiar patterns. We see what we expect to see. Hence visualization must take into account what people know and expect.
- Our working memory is very limited. We will go in depth about memory in a bit, but just understand that we can hold a very limited amount of information in our memory when looking at a visual.
Data visualization is in many some ways an external aid to support our working memory.
The power of data visualization
Remember how some visuals give you an “Aha moment” instantly? These visuals correspond naturally to the workings of visual perception and cognition. What does that mean? Ok, let’s break this down.
Visual perception is the act of seeing a visual or an image. This is handled by visual cortex located at the rear of the brain. The visual cortex is extremely fast and efficient.
Cognition is the act of thinking, of processing information, making comparisons and examining relationships. This is handled by the cerebral cortex located at the front of the brain. The cerebral cortex is much slower and less efficient.
Here is where the magic happens. Data visualization shifts the balance between perception and cognition to use our brain’s capabilities to its advantage. This means more use of visual perception and lesser use of cognition.
How do we achieve this? Before we answer this question, we need to understand how our memory works.
How human memory works and why is this important to visualization?
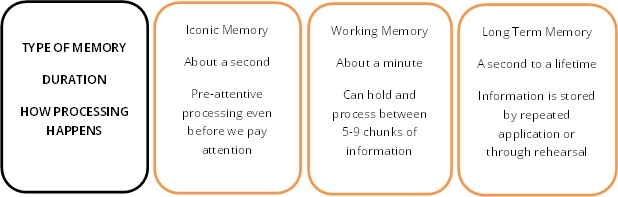
There are 3 types of memories that process information in our brain-
- Iconic memory or Sensory memory
- Working memory
- Long term memory
The long term memory is where things we memorize or remember are stored. The iconic and working memories are the ones that interact with visualizations, so let’s look at them in depth.
Iconic memory or Sensory memory:
When we see a visual, the information remains in the iconic memory for a tiny period of time, less than a second. We process and store information automatically in this fraction of a second. This process is called preattentive processing and it happens automatically, even before we pay attention to the information. The preattentive process detects several visual attributes. Hence understanding how to make a particular attribute stand out can help us create visuals that emphasize on the more important information.
Working memory or Short term memory:
This is the memory we use when we are actually working with a visual. The sensory information that is of interest to us is processed in the working memory. Information stays here for about a minute and the capacity of our working memory is between 5 to 9 similar items (Miller’s Law).
The capacity of our working memory can be increased by a process called Chunking, which is grouping similar items together.
Data visualizations take advantage of chunking. When information is displayed in the form of visuals that show meaningful patterns, more information can be chunked together. Hence, when we look at a visual, we can process a great deal more information than what we can when looking at the data in the form of a table.
For a visualization to be effective, we need to pay attention to not providing more data than what our brains can process. It is also important to display the visual on a screen or a single location, such that we can see it without having to scroll or bounce back and forth between multiple locations.
Conclusion
This is the real power of visualization – the ability to get across lot more complex information than what our visual or verbal memory can generally hold.
In part 2 of this post, we will see how to interact with our sensory memory and preattentive processing.
References and Further Reading:
There is a lot of great literature available on this topic. If you are interested in reading more on this topic, here are some reference textbooks and websites.
- Chapter 5 of Show Me the Numbers by Stephen Few
- Chapter 3 of Now you see it by Stephen Few
- Information Visualization: Perception for Design, Colin Ware
- https://www.interaction-design.org/literature/article/the-properties-of-human-memory-and-their-importance-for-information-visualization
[mc4wp_form id=”361″]


One Comment