Gender equality in leadership (Reykjavik index)
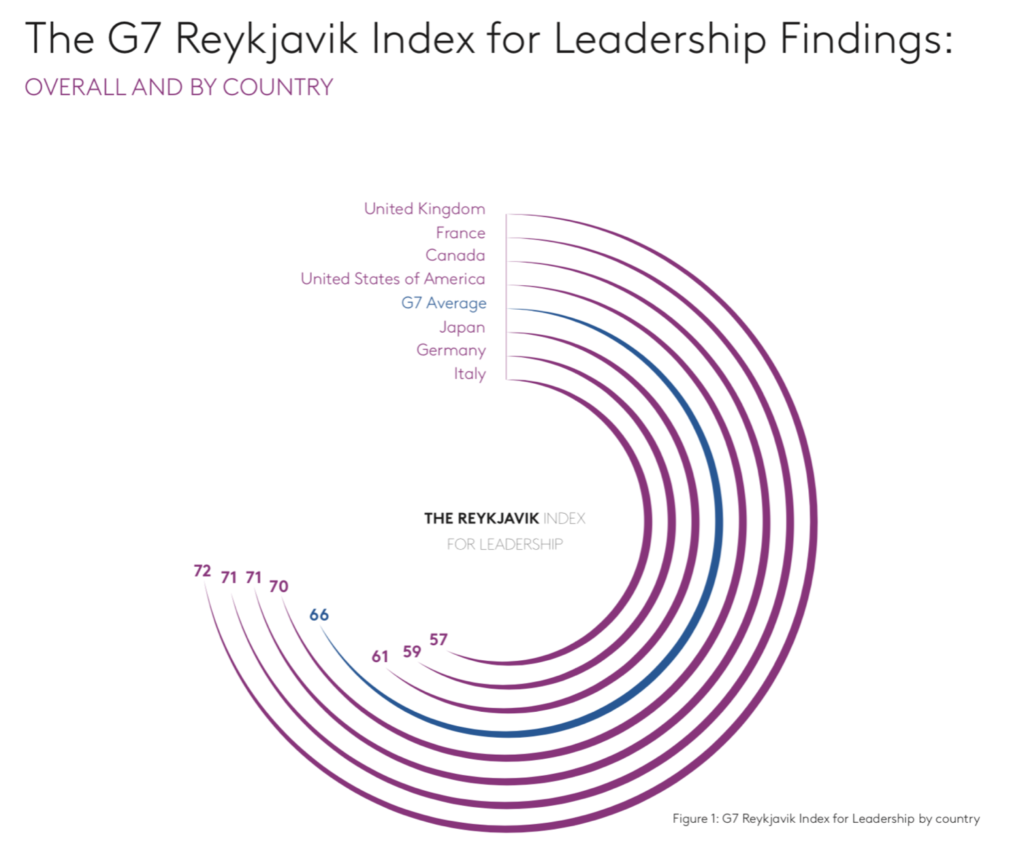
Challenge: Visualise gender equality in leadership across G7 nations using the Reykjavík Index, moving away from misleading circular/radial bar charts.
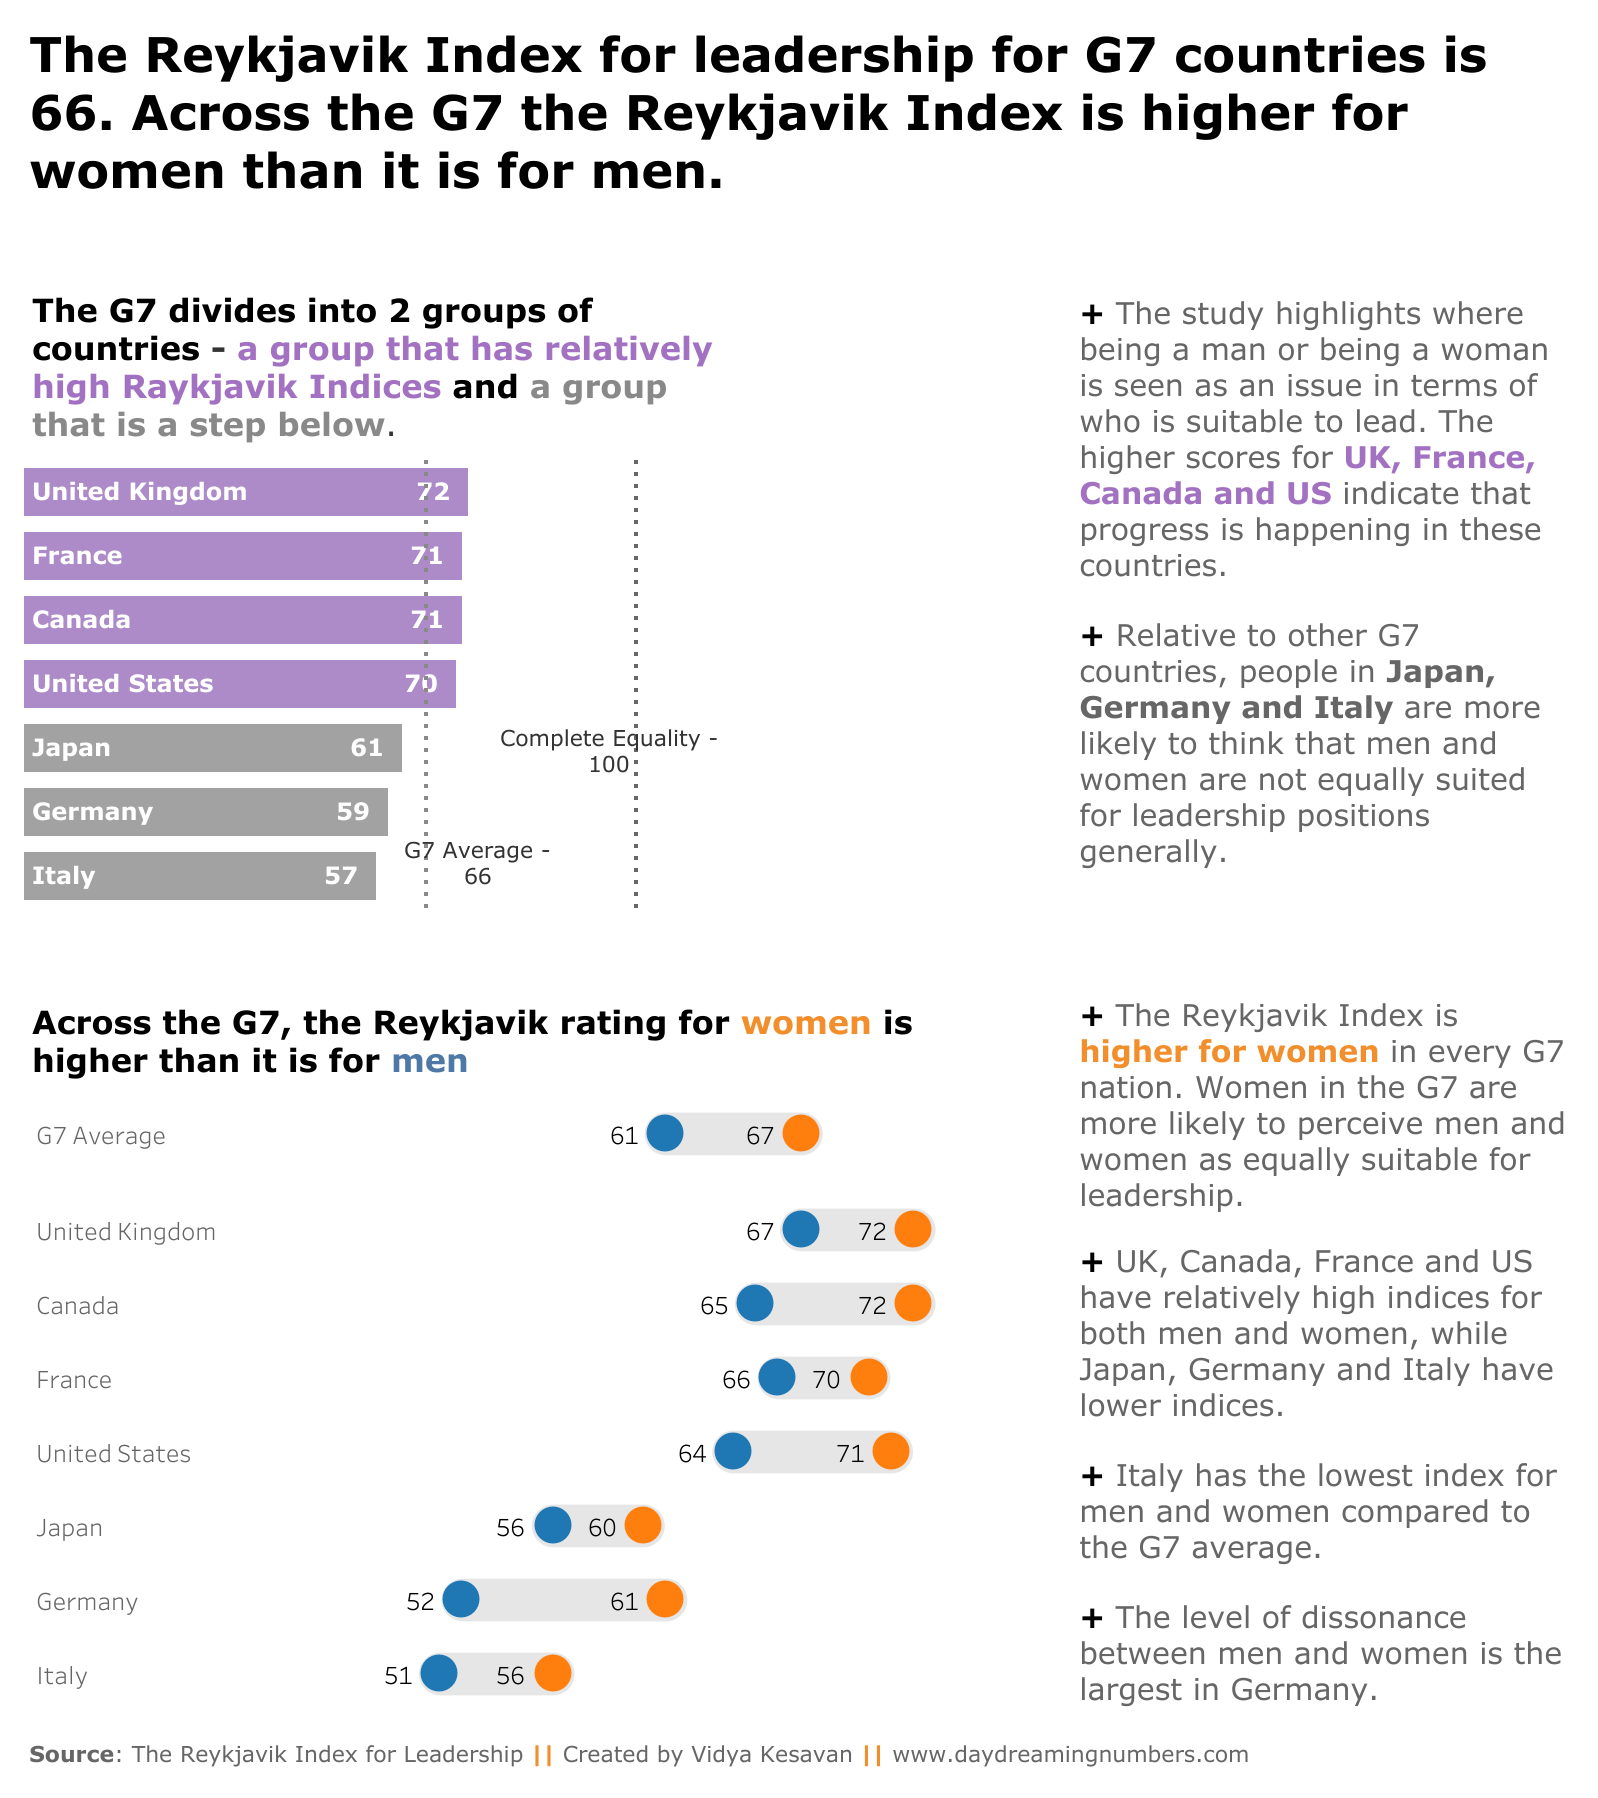
Design decisions: Circular/radial bar charts look cool but are very hard to read. The bar lengths can be misleading because each bar is judged by its angle, not length. I redesigned it using two complementary visualisations: a simple bar chart showing each country’s index score against the G7 average and the goal of 100, and a range plot revealing the gender dissonance which is the gap between how men and women perceive leadership equality.
The result: Individual country performance and progress toward gender parity become instantly comparable. The redesign immediately reveals that the Reykjavik Index is higher for women (67) than for men (61) across the G7, meaning women are more likely to view men and women as equally suitable for leadership.
Tools: Tableau
Source: Reykjavík Index for Leadership / Kantar Public