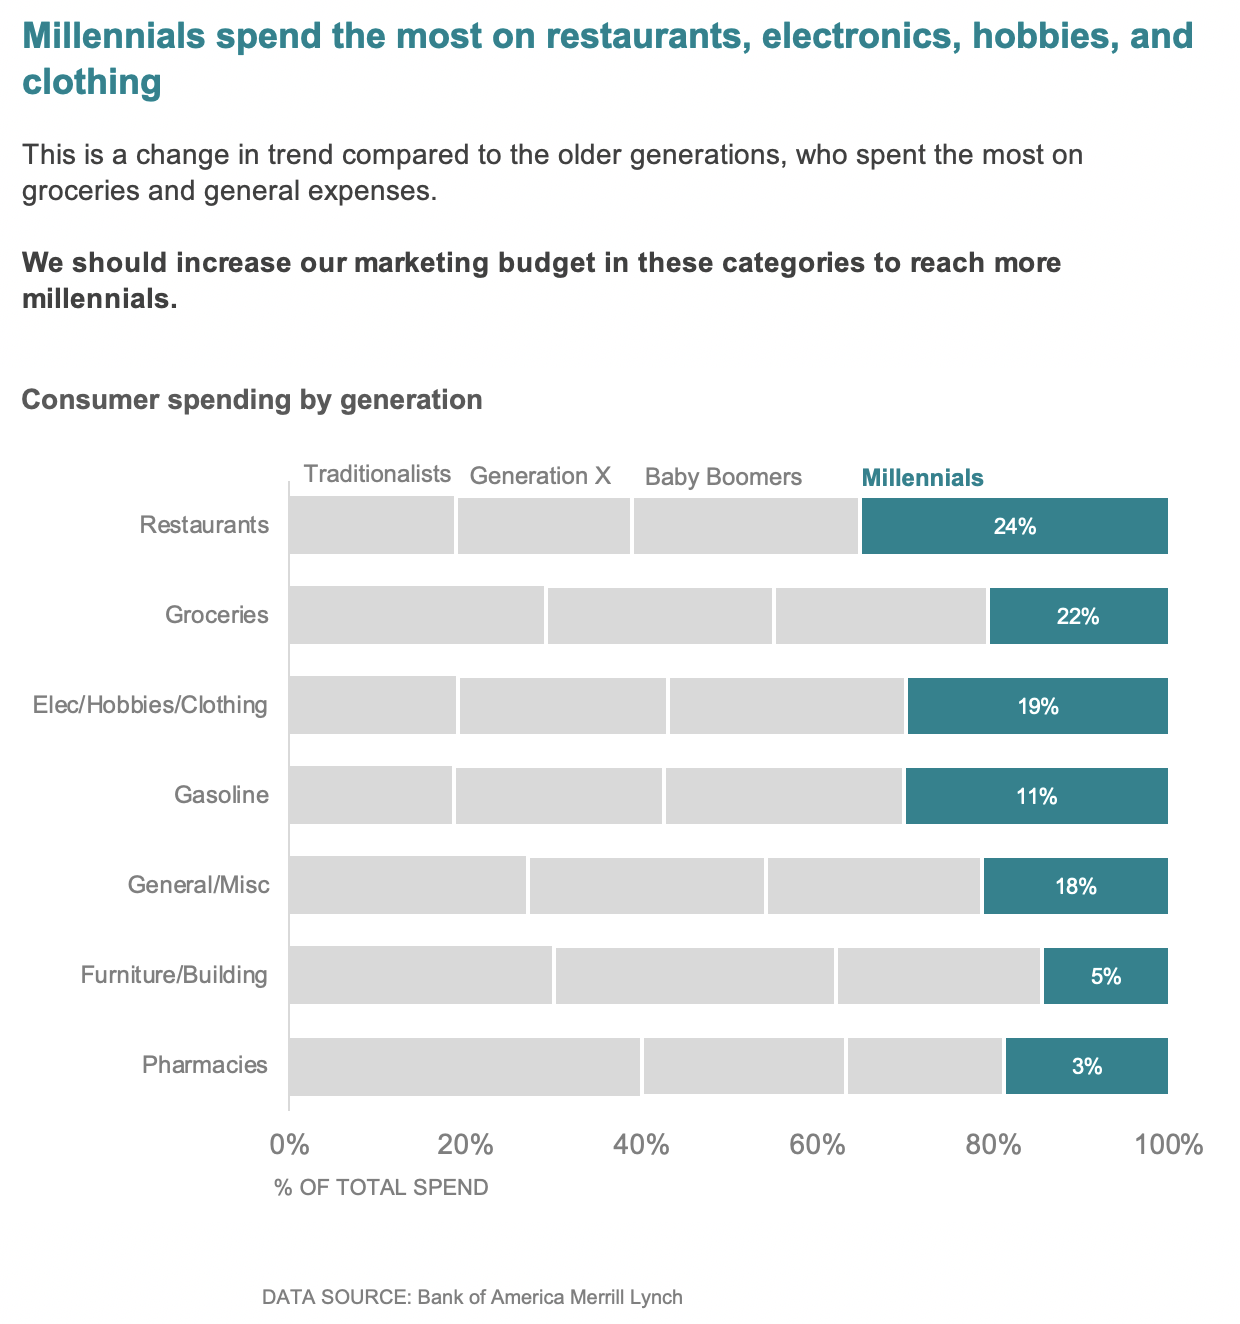
Consumer spending by generation
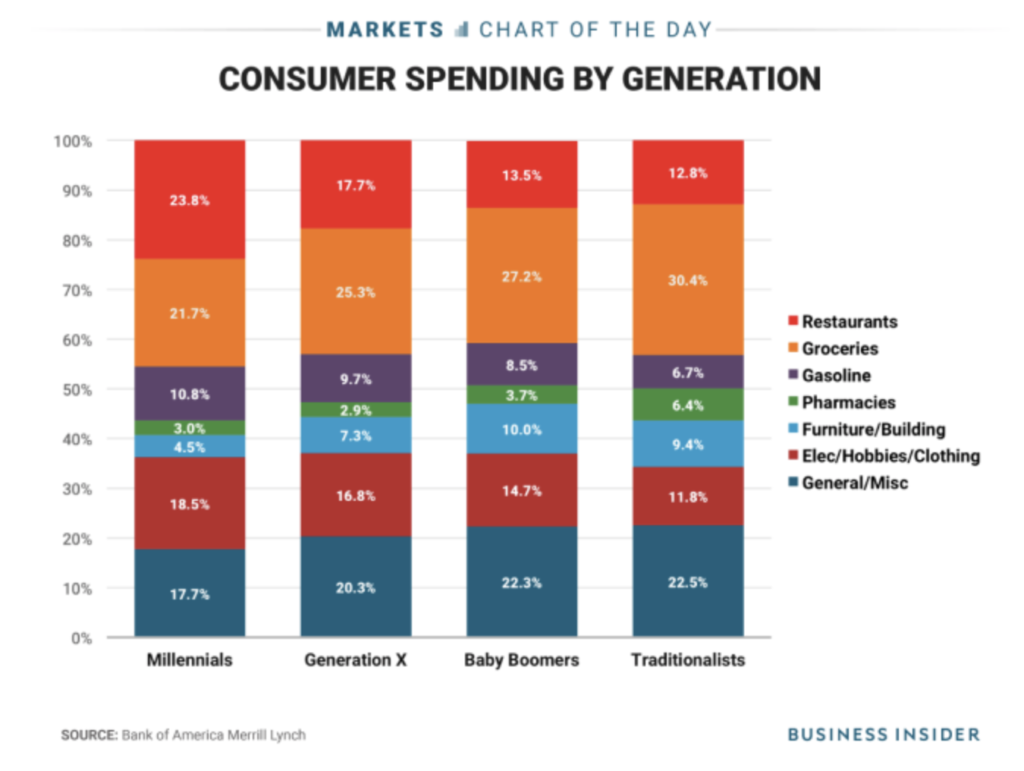
Challenge: Transform a cluttered generational spending chart into a focused, actionable visualization that highlights millennial spending patterns.
Design decisions: Rather than presenting all generational data with equal weight, I strategically used colour to highlight millennials’ unique spending allocations. The redesign reduced visual noise through intentional colour choices, highlighting the user’s attention to Restaurants and Elec/Hobbies/Clothing – the top categories where millennials outspend older generations.
The result: The visualisation now answers a specific business question: “Where should we increase marketing budget to reach millennials?” A clear headline communicates the key insight immediately and intentional use of colour directs the viewer’s attention to the millennials’ data.
Tools: Microsoft Excel
Source: Bank of America Merrill Lynch via Yahoo! Finance