Pie charts do not work well for comparisons
Pie charts are the most controversial charts in Data Visualization. With arguments ranging from don’t use pie charts ever to let’s use them when appropriate, there are a lot of opinions on pie charts.
Rightly so. Because there is so much we still do not understand about pie charts and let’s face it, there are some pretty bad examples of pie charts out there.
In this article, we are going to look at one best practice when using pie charts:
Do not use pie charts for comparisons.
Research shows that people’s confidence and accuracy when reading numbers from pie charts is much lower than from other kinds of charts.
Let’s see why.
Here is an example of a pie chart comparison.
Go ahead and see for yourself how accurately you can compare the values.
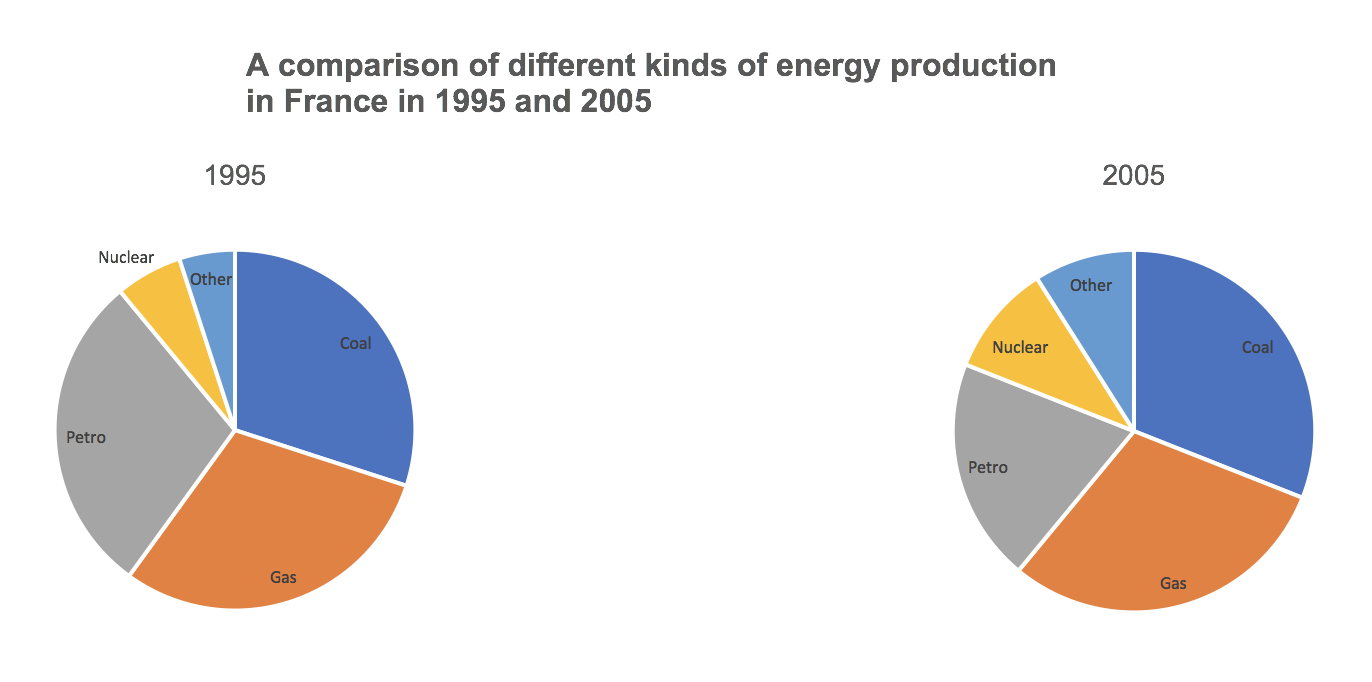
Did coal increase or decrease? What about Gas? Not sure?
How do we read Pie Charts?
A pie chart has 3 visual cues that help us read them:
- Angle of the slice (compared to the full circle)
- Area of the slice (compared to the full circle)
- Arc length (the length of the circle arc on the outside)
Up until now, we assumed that we read pie charts based on the angle of the slice. New research conducted by Robert Kosara and Drew Skau suggest that we read pie charts based on a combination of all 3 cues – angle, area and arc length.
From their research paper titled “Judgment Error in Pie Chart Variations“:
In a recent study, we found that contrary to general belief, there is no clear evidence that these charts are read based on the central angle. Instead, area and arc length appear to be at least equally important.
Here is the catch though. We are not especially good at measuring either of these 3 visual cues. We can measure 90 and 180 degree angles with some confidence but we struggle to measure other angles.
We can compare areas and arc lengths that are widely different, but when the difference is small, we cannot compare them with confidence.
This is the reason Pie Charts do not work well for comparisons.
From Robert Kosara’s article on Eager Eyes:
We have conducted some research that showed that people’s confidence when reading numbers from pie charts is much lower than from other kinds of charts, and with good reason: their accuracy was also much lower.
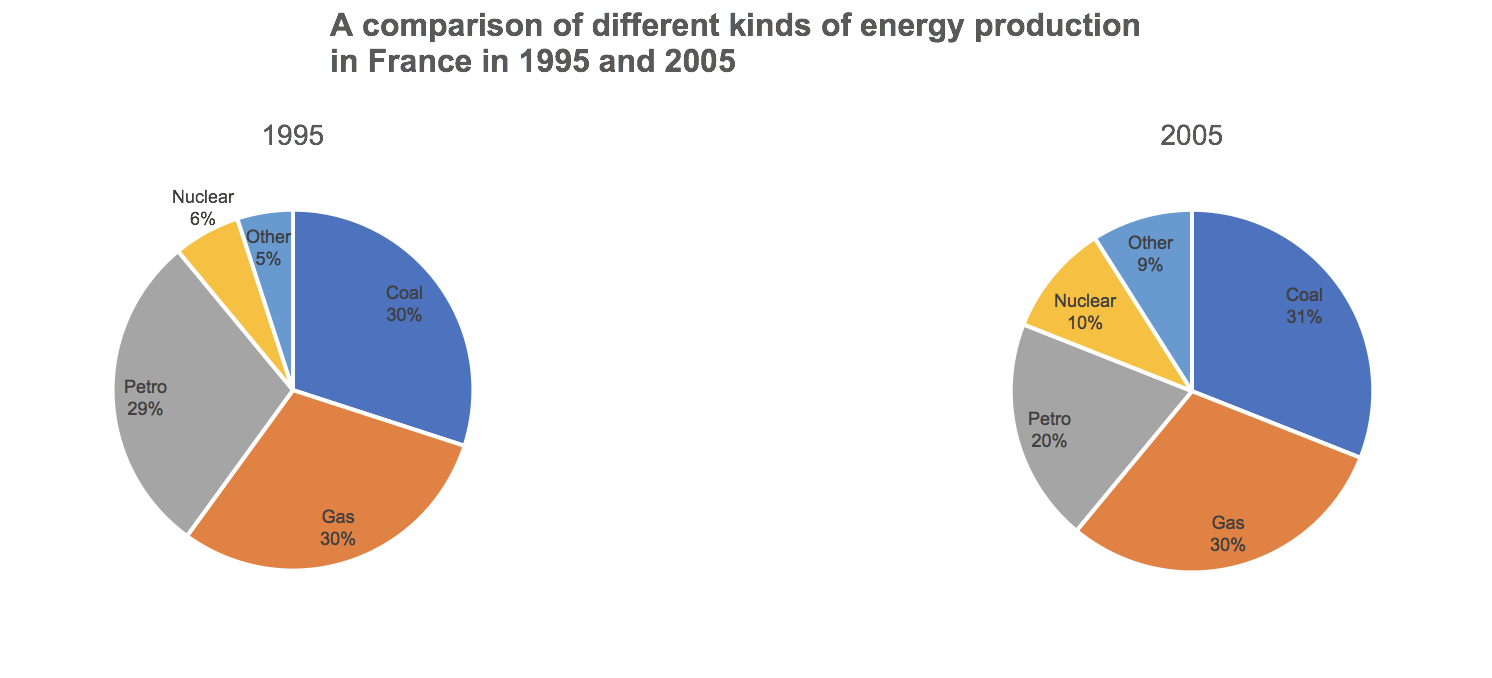
This means that we have to label every category and value of a pie chart – which makes reading them very annoying.
Like this one:
In contrast, a bar chart (any type of bar chart) would make the comparison so much easier.