Makeover Monday: What kind of waste appears on UK beaches?
For this week, I created a quick makeover using Datawrapper. My aim was to allow easy comparison between the 10 waste sources. I chose to use the trusted old bar chart.

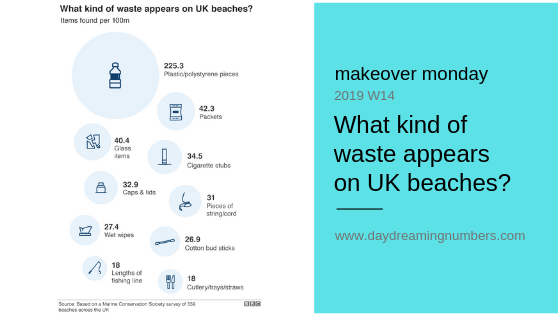
For this week, I created a quick makeover using Datawrapper. My aim was to allow easy comparison between the 10 waste sources. I chose to use the trusted old bar chart.
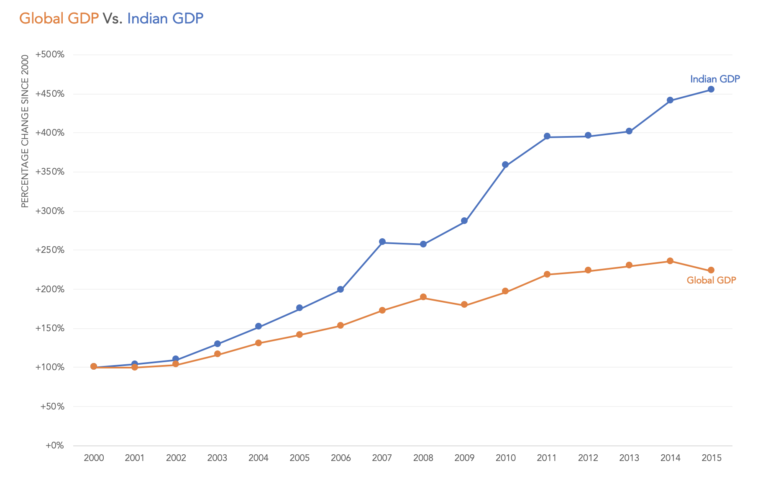
Indexing data is an effective method to normalize the data to a common starting point and observe how variables change over time relative to each other.
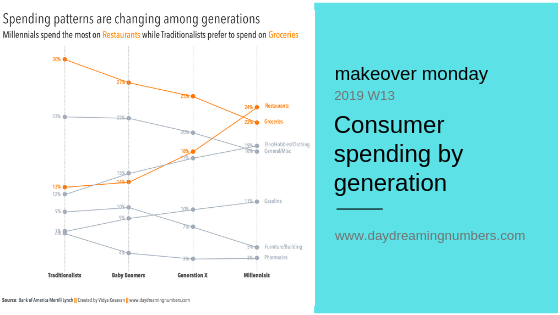
The challenge with stacked bar charts is that if there is something interesting happening further up the stack, it becomes difficult to see because it is stacked on top of other things that are also changing. In this chart, with 7 different colours, it is hard to understand what’s going on.
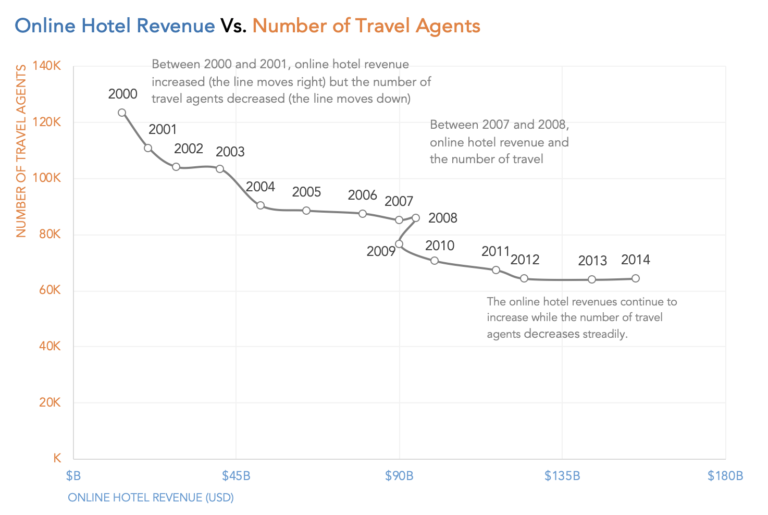
A connected scatterplot is a scatterplot with a third ordered variable used to connect the encoding between X and Y positions. This third variable is often time.
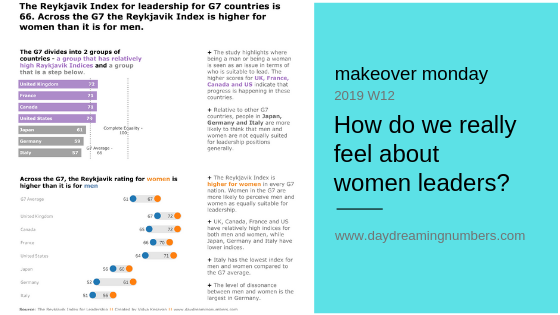
Original Analysis of the original Here are a series of questions I use to analyse a chart. Where are my eyes drawn?: My eyes are drawn to the blue arc for G7 average. What works in this visual?: The circular bars are sorted. Good use of colors to represent countries and average. Identify clutter, make…

Let’s talk about what to use instead of dual axis charts. Here are 5 alternatives – Side-by-side charts. 2 charts labelled directly, Prioritizing and levelling, connected scatterplot and indexed charts.
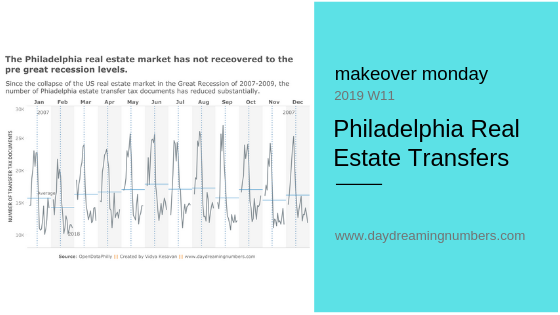
We sometimes come across a dataset that stumps us. The Philadelphia Real Estate Transfers was one such dataset for me. Inspired by Eva Murray’s work, I decided to use a cycle plot here.