Makeover Monday: Philadelphia Real Estate Transfers
We sometimes come across a dataset that stumps us. The Philadelphia Real Estate Transfers was one such dataset for me. Inspired by Eva Murray’s work, I decided to use a cycle plot here.

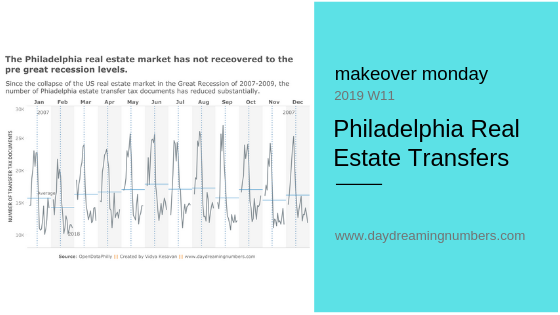
We sometimes come across a dataset that stumps us. The Philadelphia Real Estate Transfers was one such dataset for me. Inspired by Eva Murray’s work, I decided to use a cycle plot here.
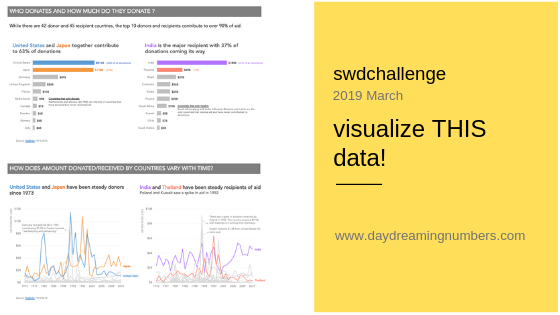
This month’s #SWDChallenge was to visualize a specific dataset and create visualization(s) to answer specific questions. This is different from an open-ended data analysis where we go on looking for interesting stories in the data. Most often in our jobs, we use data visualization to communicate answers to predefined questions – for example, who are…
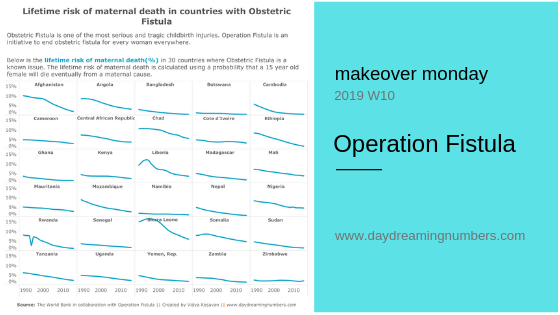
My aim with this makeover was to create a chart that shows the relation between Obstetrics Fistula (OF) and lifetime maternal deaths in various countries.

Sometimes we need more than one chart to communicate our message. This makeover is a good example of how one chart may be inadequate to convey the whole story.

My aim with this makeover was to declutter the chart and show 3 pieces of information – installed capacity, investment and number of homes powered by Wind Energy.

The original shows 297 hours in executive time. I wanted to answer the question what percentage of each workday does Trump spend in executive time?

For this month’s SWDChallenge, Cole challenged us to visualize the variance in data. The mode, the median or the mean may not be a model that represents the entire dataset accurately. Hence it is important to visualize variance.