How to use waterfall charts?
What is a waterfall chart?
A waterfall chart is used to show how an initial value is increased and/or decreased by a series of intermediate values, leading to a final value.
A waterfall chart helps us understand how different factors combine to achieve a final result.
Waterfall charts are commonly used in businesses to arrive at net profit or loss considering the sales and expenses. These charts can also be used by Human Resource managers to evaluate end of year headcounts for a company or department.
Examples of waterfall charts
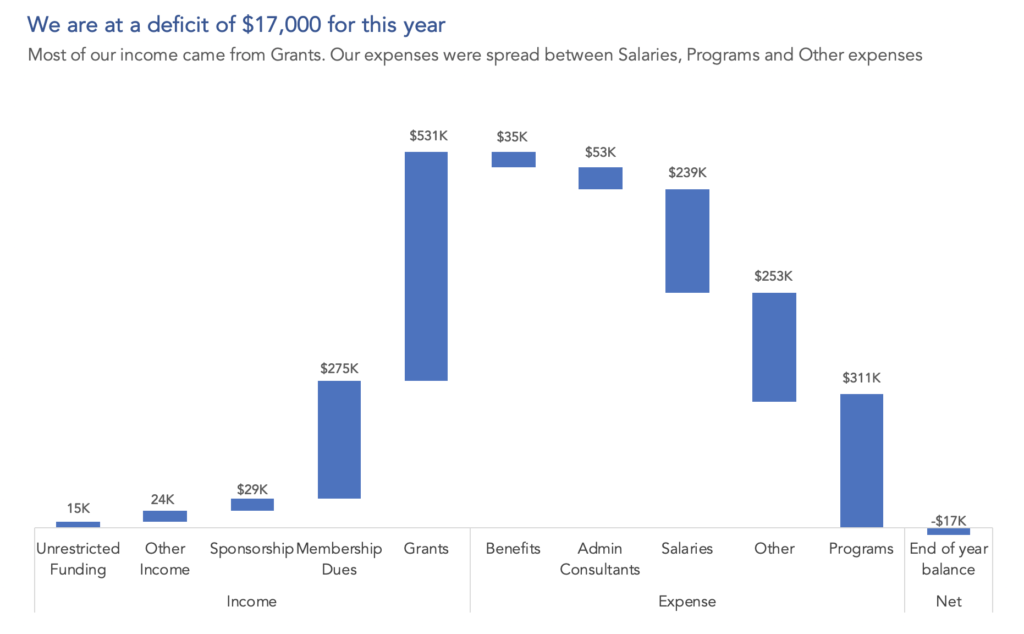
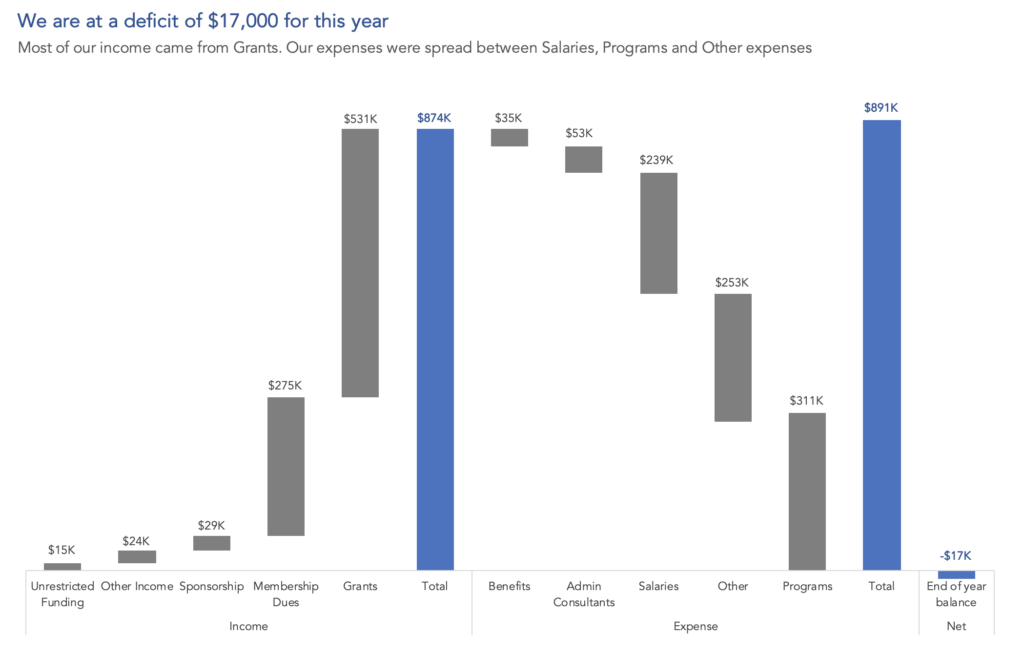
The waterfall chart below shows cash flow from 5 sources of income and 5 sources of expenses, along with the net end of year balance.
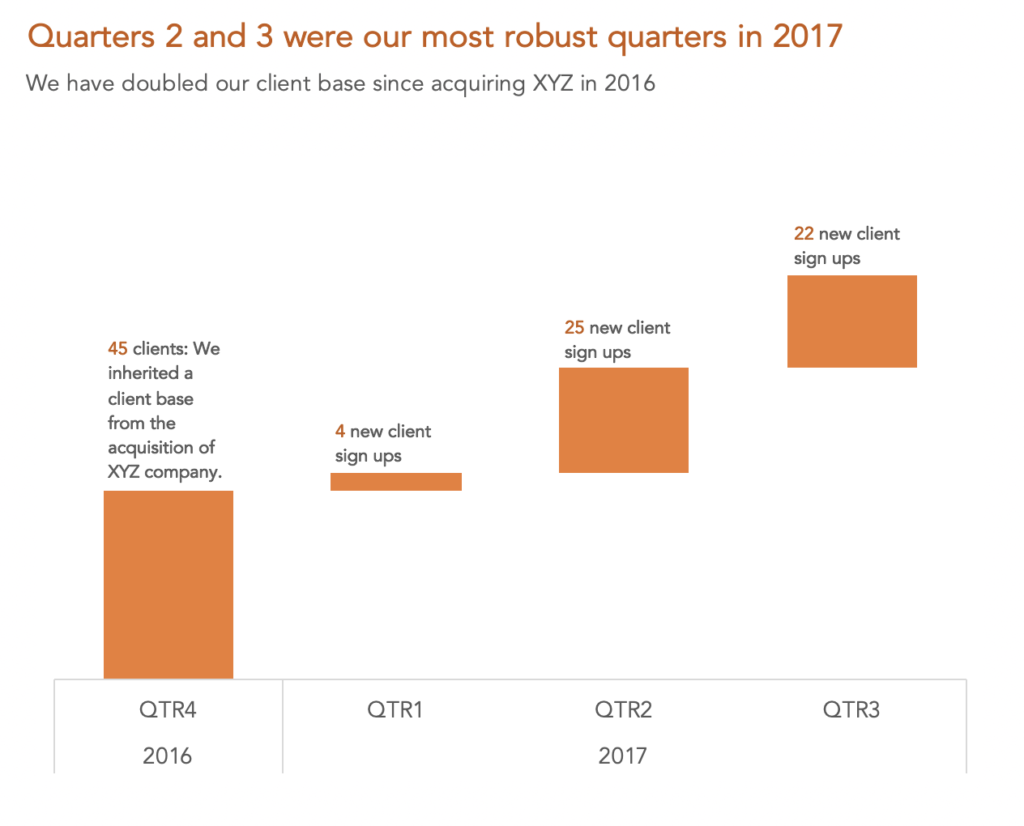
Waterfall charts can also be used to show just positive or negative values. The chart below shows the number of new clients added per quarter (with no clients dropping out).
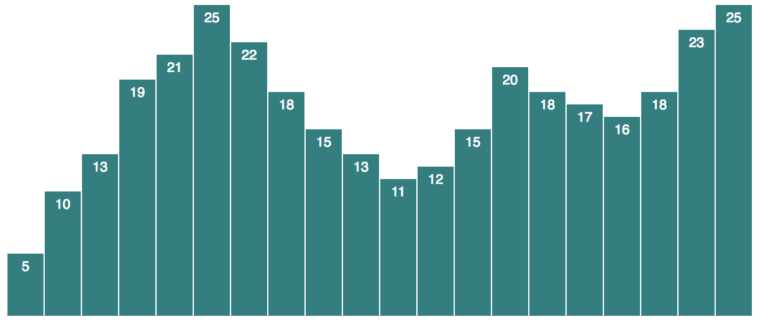
Sometimes we may want to highlight intermediate results in a waterfall chart and show them as full bars, like in this example below.
How to create waterfall charts?
Excel 2016 comes with built in waterfall charts, but it is not very flexible. There are multiple ways to create waterfall charts in excel. I used this brute force method. This is another way to create them in excel.
If you want to see how I created these in excel, you can download the excel file for these waterfall charts here.
Considerations when using waterfall charts
- Label directly: Bars with no zero base are hard to interpret. Hence its useful to label the bars directly in a waterfall chart.
- Different colors for positive and negative values: Use this if it is important to differentiate the positive and negative values. But be mindful of the color choices.
- Sort the bars: If there is no intrinsic order to the categories, it’s a good idea to sort the values (smallest to largest or largest to smallest) for positive and negative values.