Basic statistics for exploring data : Measures of Variation
What are measures of variation?
Measures of variation describe the width of a distribution. They define how spread out the values are in a dataset. They are also referred to as measures of dispersion/spread.
In this article, we will look at 4 measures of variation.
- Range
- Interquartile Range (IQR)
- Variance
- Standard Deviation
We will also see examples of how to calculates these measures of variation and when to use them. But before we get started, let’s understand why we need measures of variation in addition to measures of centre when exploring data for visualization.
Why do we need measures of variation?
A single statistic – the mode, the median or the mean may not be a model that represents the entire dataset accurately. Anytime we use a single number to represent the data, we lose the sense of variability in the data.
Do averages tell the whole story?
An average is a good measure to compare performance of “a group” over time. One way to think of an average is like a snapshot of a movie. It does not tell the whole story, it just gives a snapshot of a frame. Averages ignore the impact of the inevitable variations that occur in the data.
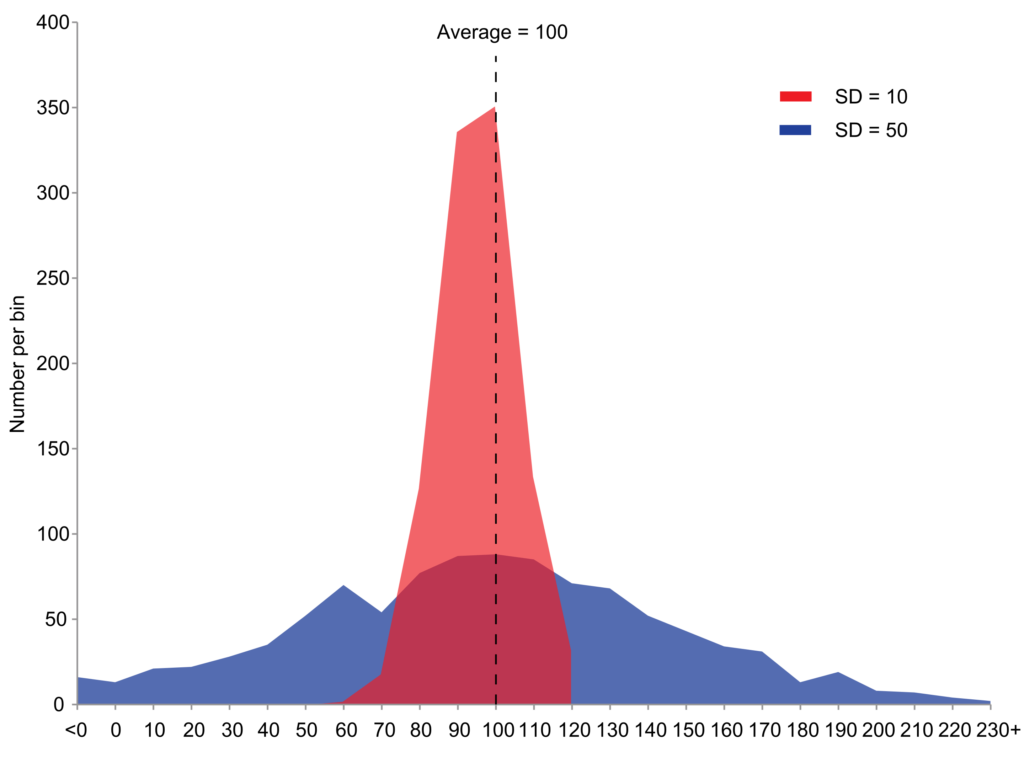
Here is an example of two sample populations with the same mean and different standard deviations. Red population has mean 100 and SD 10; blue population has mean 100 and SD 50.
What are the disadvantages of averages?
- Averages do not tell the whole story
- Averages are susceptible to outliers. Outliers skew the averages and pull them in their direction. Averages make us believe data points are clustered around a point higher or lower than where they truly cluster.
- Averages do not account for segments in data.
“…, many people tend to think of “average” as “typical;” the problem with that assumption in many data sets — certainly those involving humans — is there are many, many, exceptions to “typical.” One could even argue there is no such thing as “typical.” For example, one commonly misused statistic is the average divorce rate in the United States, which is often cited as “about 50%.” If one researches the question, they will discover average divorce rates vary widely based on factors such as age, level of educational attainment, profession, race, geography, religious beliefs, etc. As such, everyone is categorized differently by these factors resulting in many different average divorce rates depending on which factors describe those being measured.”
towardsdatascience.com
Understanding Measures of Variation
Range
Range is the simplest measure of variation. The range of a dataset is the difference between the highest value and the lowest value in the dataset.
Range is also the most affected by outliers as it uses only the extreme values.
Interquartile Range (IQR)
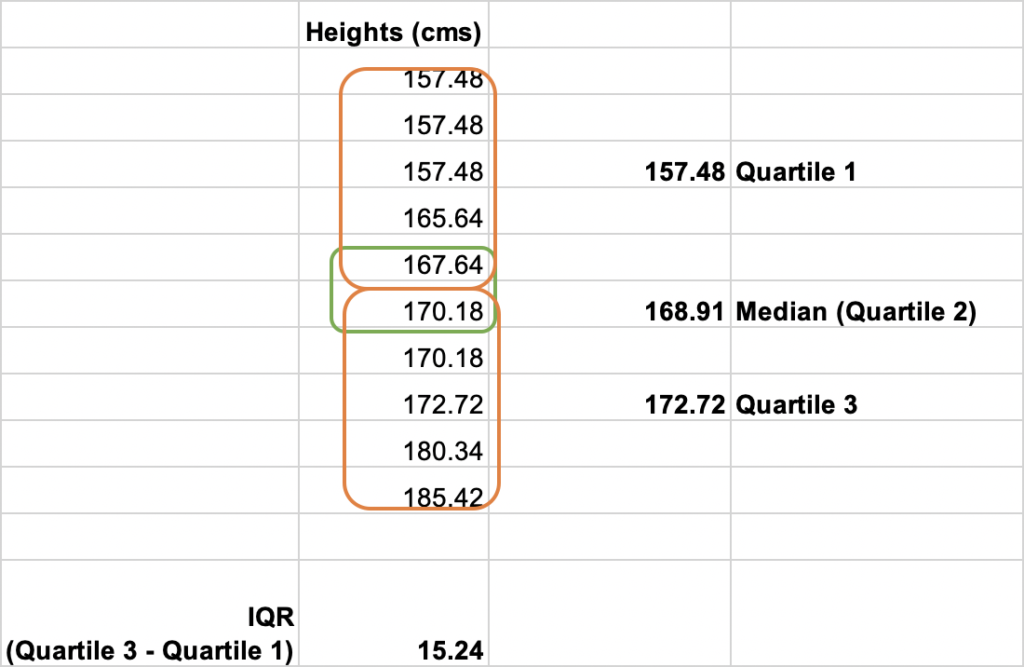
The Interquartile Range or IQR describes the middle 50% of the values when ordered from lowest to highest value.
To calculate the IQR, we find the median of the lower and upper half of the data. These are Quartile 1 and Quartile 3. The IQR is the difference between Quartile 3 and Quartile 1.
IQR is considered a good measure of variation in skewed datasets as it is resistant to outliers.
Variance
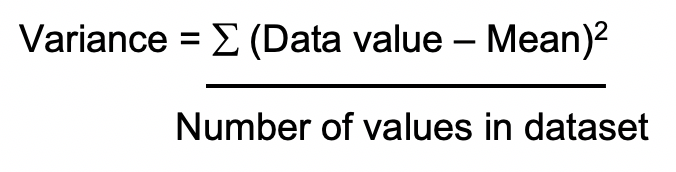
Variance is the average squared difference of values from the mean.
To calculate variance, we square the difference between each data value and the mean. We divide the sum of these squares by the number of items in the dataset.
Because variance is a squared quantity, there is no intuitive way to compare variance directly to data values or mean.
Standard Deviation
Standard deviation is a measure of how much data values deviate away from the mean. Larger the standard deviation, greater the amount of variation.
Standard deviation is calculated as the square root of variance.

Standard deviation uses the original units of data which makes interpretation easier. Hence standard deviation is the most commonly used measure of variation.
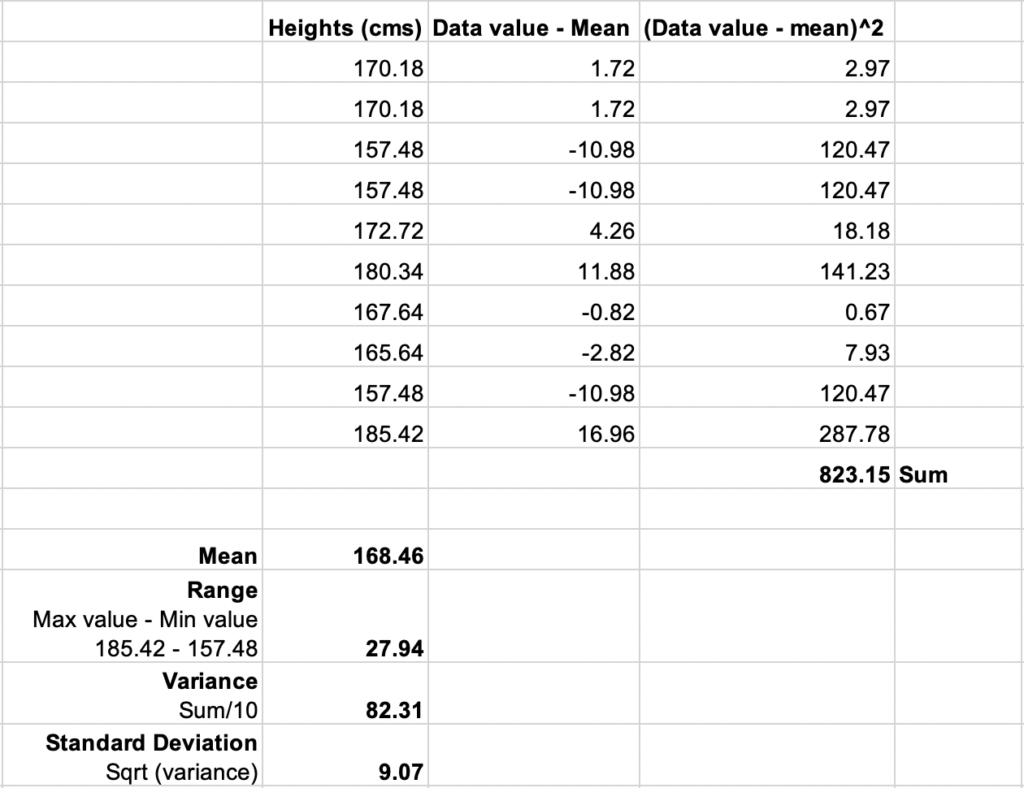
Calculate Range, IQR, Standard Deviation and Variance : Example
Let’s consider a small dataset of heights of 10 people. Here is how we can calculate the range, variance, standard deviation and interquartile range.
Here is a video tutorial to learn more about calculating interquartile range.
When to use Range, IQR, Standard Deviation and Variance?
- Range uses only the extreme values of a dataset and is hence very susceptible to outliers. It is advisable to use range only for very small distributions with no outliers.
- IQR is good for skewed distributions. This is because IQR is resistant to outliers in the data. They are generally paired with median to describe the data.
- Standard deviation is a good measure of variability for normal distributions or distributions that aren’t terribly skewed. Paired with mean this is a good way to describe the data.
- Variance is not used much as it is represented in squared units and is not an intuitive measure.


One Comment