How to use cycle plots to show seasonality?
Why cycle plots?
Line charts are often used to show the month of the year or day of the week effect. This is useful when we want to understand the impact of month of year or day of the week on the data we are analyzing.
Multiple line charts
For example, in this sales data for 6 weeks, let’s say we want to understand the day of the week effect on the sale amounts. We could use a line chart with multiple lines, each representing a week to see this effect.
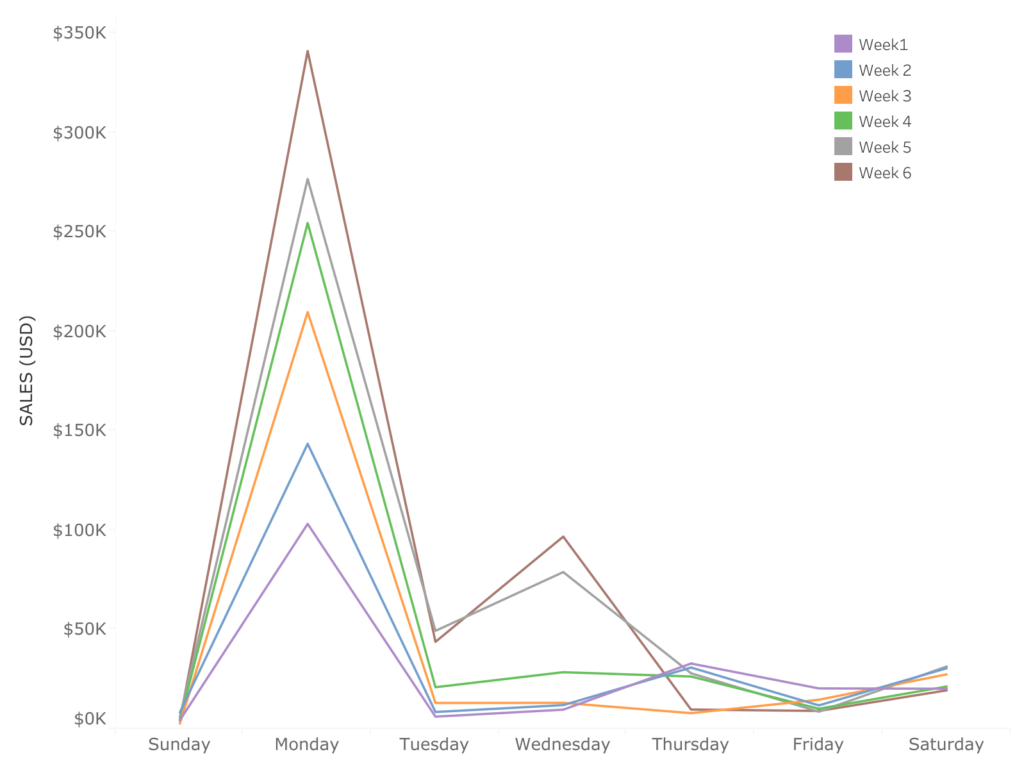
We can see that sales peak on Mondays and drop gradually as we get to the end of the week on Sunday.
However, it is difficult to see a trend over the 6-week period with this chart.
Single line chart
Data plotted as a single line chart often shows the presence or absence of trends/cycles. Let’s plot the same data in a single line chart.
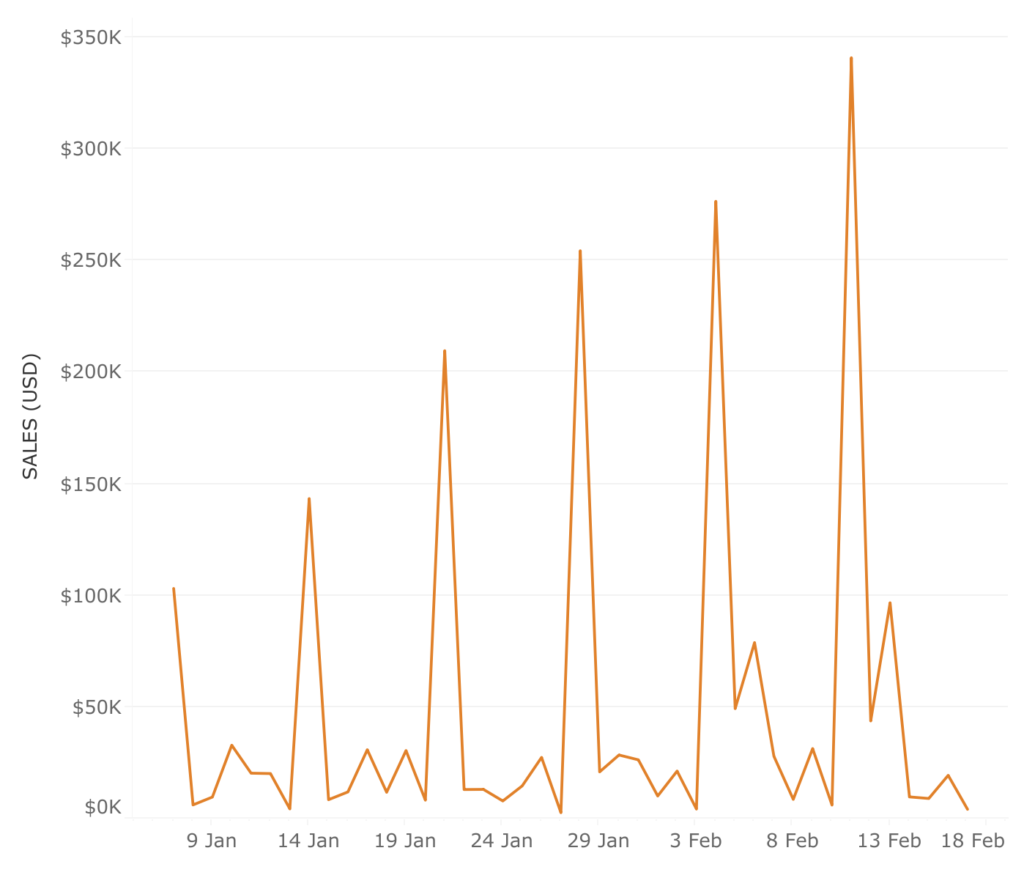
Here we can see the trends – week-on-week sales have been increasing on some days. But the rest of it is fairly constant.
However, it is difficult to see the effect of the weekday on sales.
Both these charts – multiple line charts and single line chart – have their strengths and weaknesses. This is where cycle plots are useful.
What are cycle plots?
A cycle plot shows both days of the week/month of the year effect and trend/cycle in data. Cycle plots were created by Willian Cleveland and his colleagues in 1978 at Bell Labs.
Example 1
Here is an example of the sales data plotted as a cycle plot.
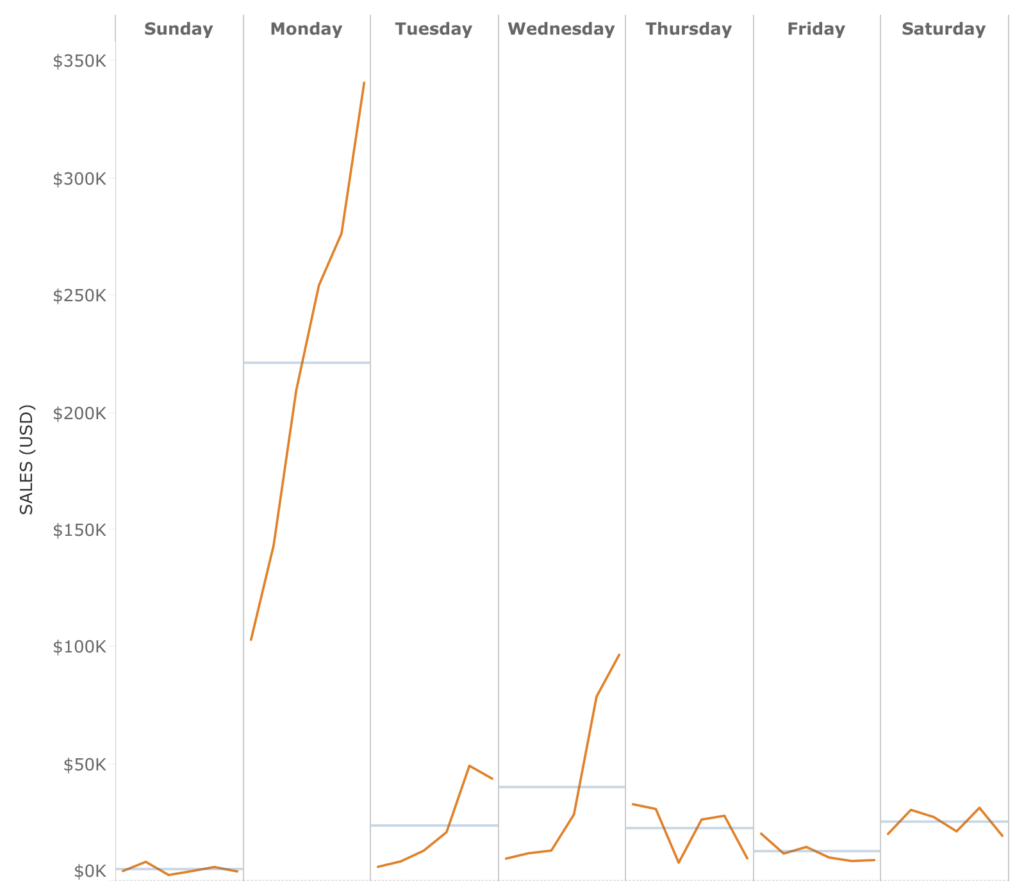
Our findings from multiple line charts – sales peak on Mondays and drops gradually as we get to the end of the week on Sunday – is clearly visible in this chart. The findings from a single line chart – week-on-week sales have been increasing on a few days – is also noticeable in this chart.
But there are other insights that a cycle plot provides which either of the other two charts could not. For instance, the sales for Tuesdays and Wednesdays are also on the rise. The sales for Sundays and Fridays are flat. The other days show a lot of ups and downs in sales.
A chart like this can prompt a sales head to ask a lot of useful questions. What are we doing differently on Mondays, Tuesdays, and Wednesdays? What is helping sales especially on Mondays?
Example 2
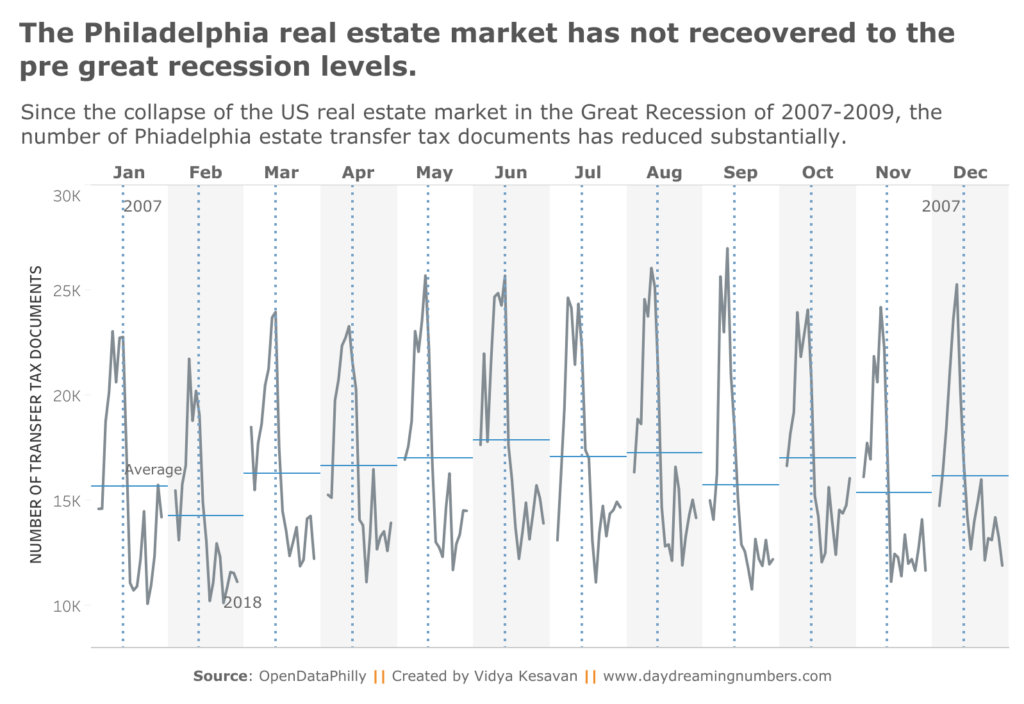
Here is another example of a cycle plot showing the seasonality in Philadelphia real estate transfers. This chart allows us to see the impact of the Great Recession on real estate transfers.
Cycle plots:
- separate each series into its own section.
- are useful to study the behavior of seasonal time series.
- show cyclical patterns over time.
- can show information without the need for individual colors for each series.
How to create cycle plots?
Here are some useful resources on how to create cycle plots.
Tableau:
Excel:


Very informative and great article. Thanks a lot for sharing.