Nike in Asia – Visualization project
This visualization project was created as part of the MakeOverMonday project.
Dataset
The dataset for this project is hosted on Data.world
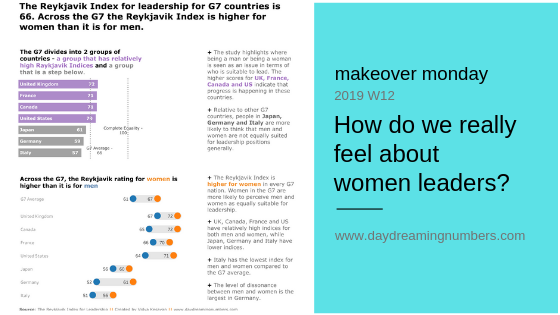
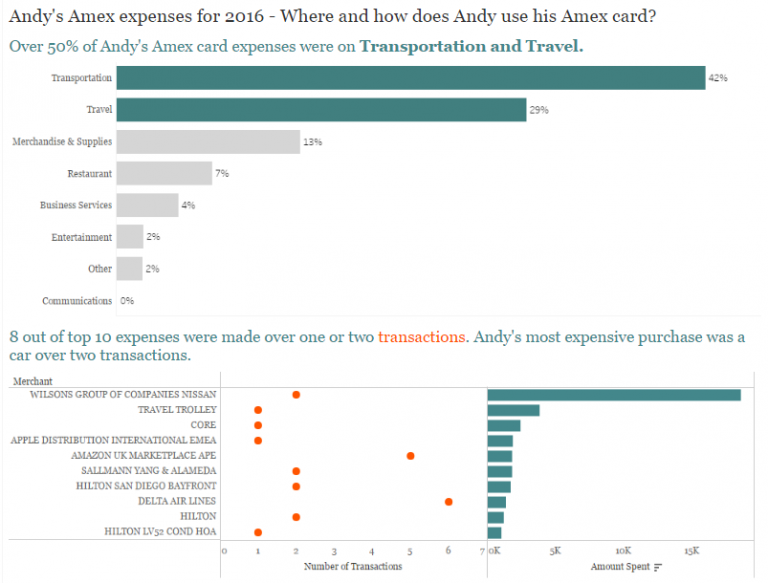
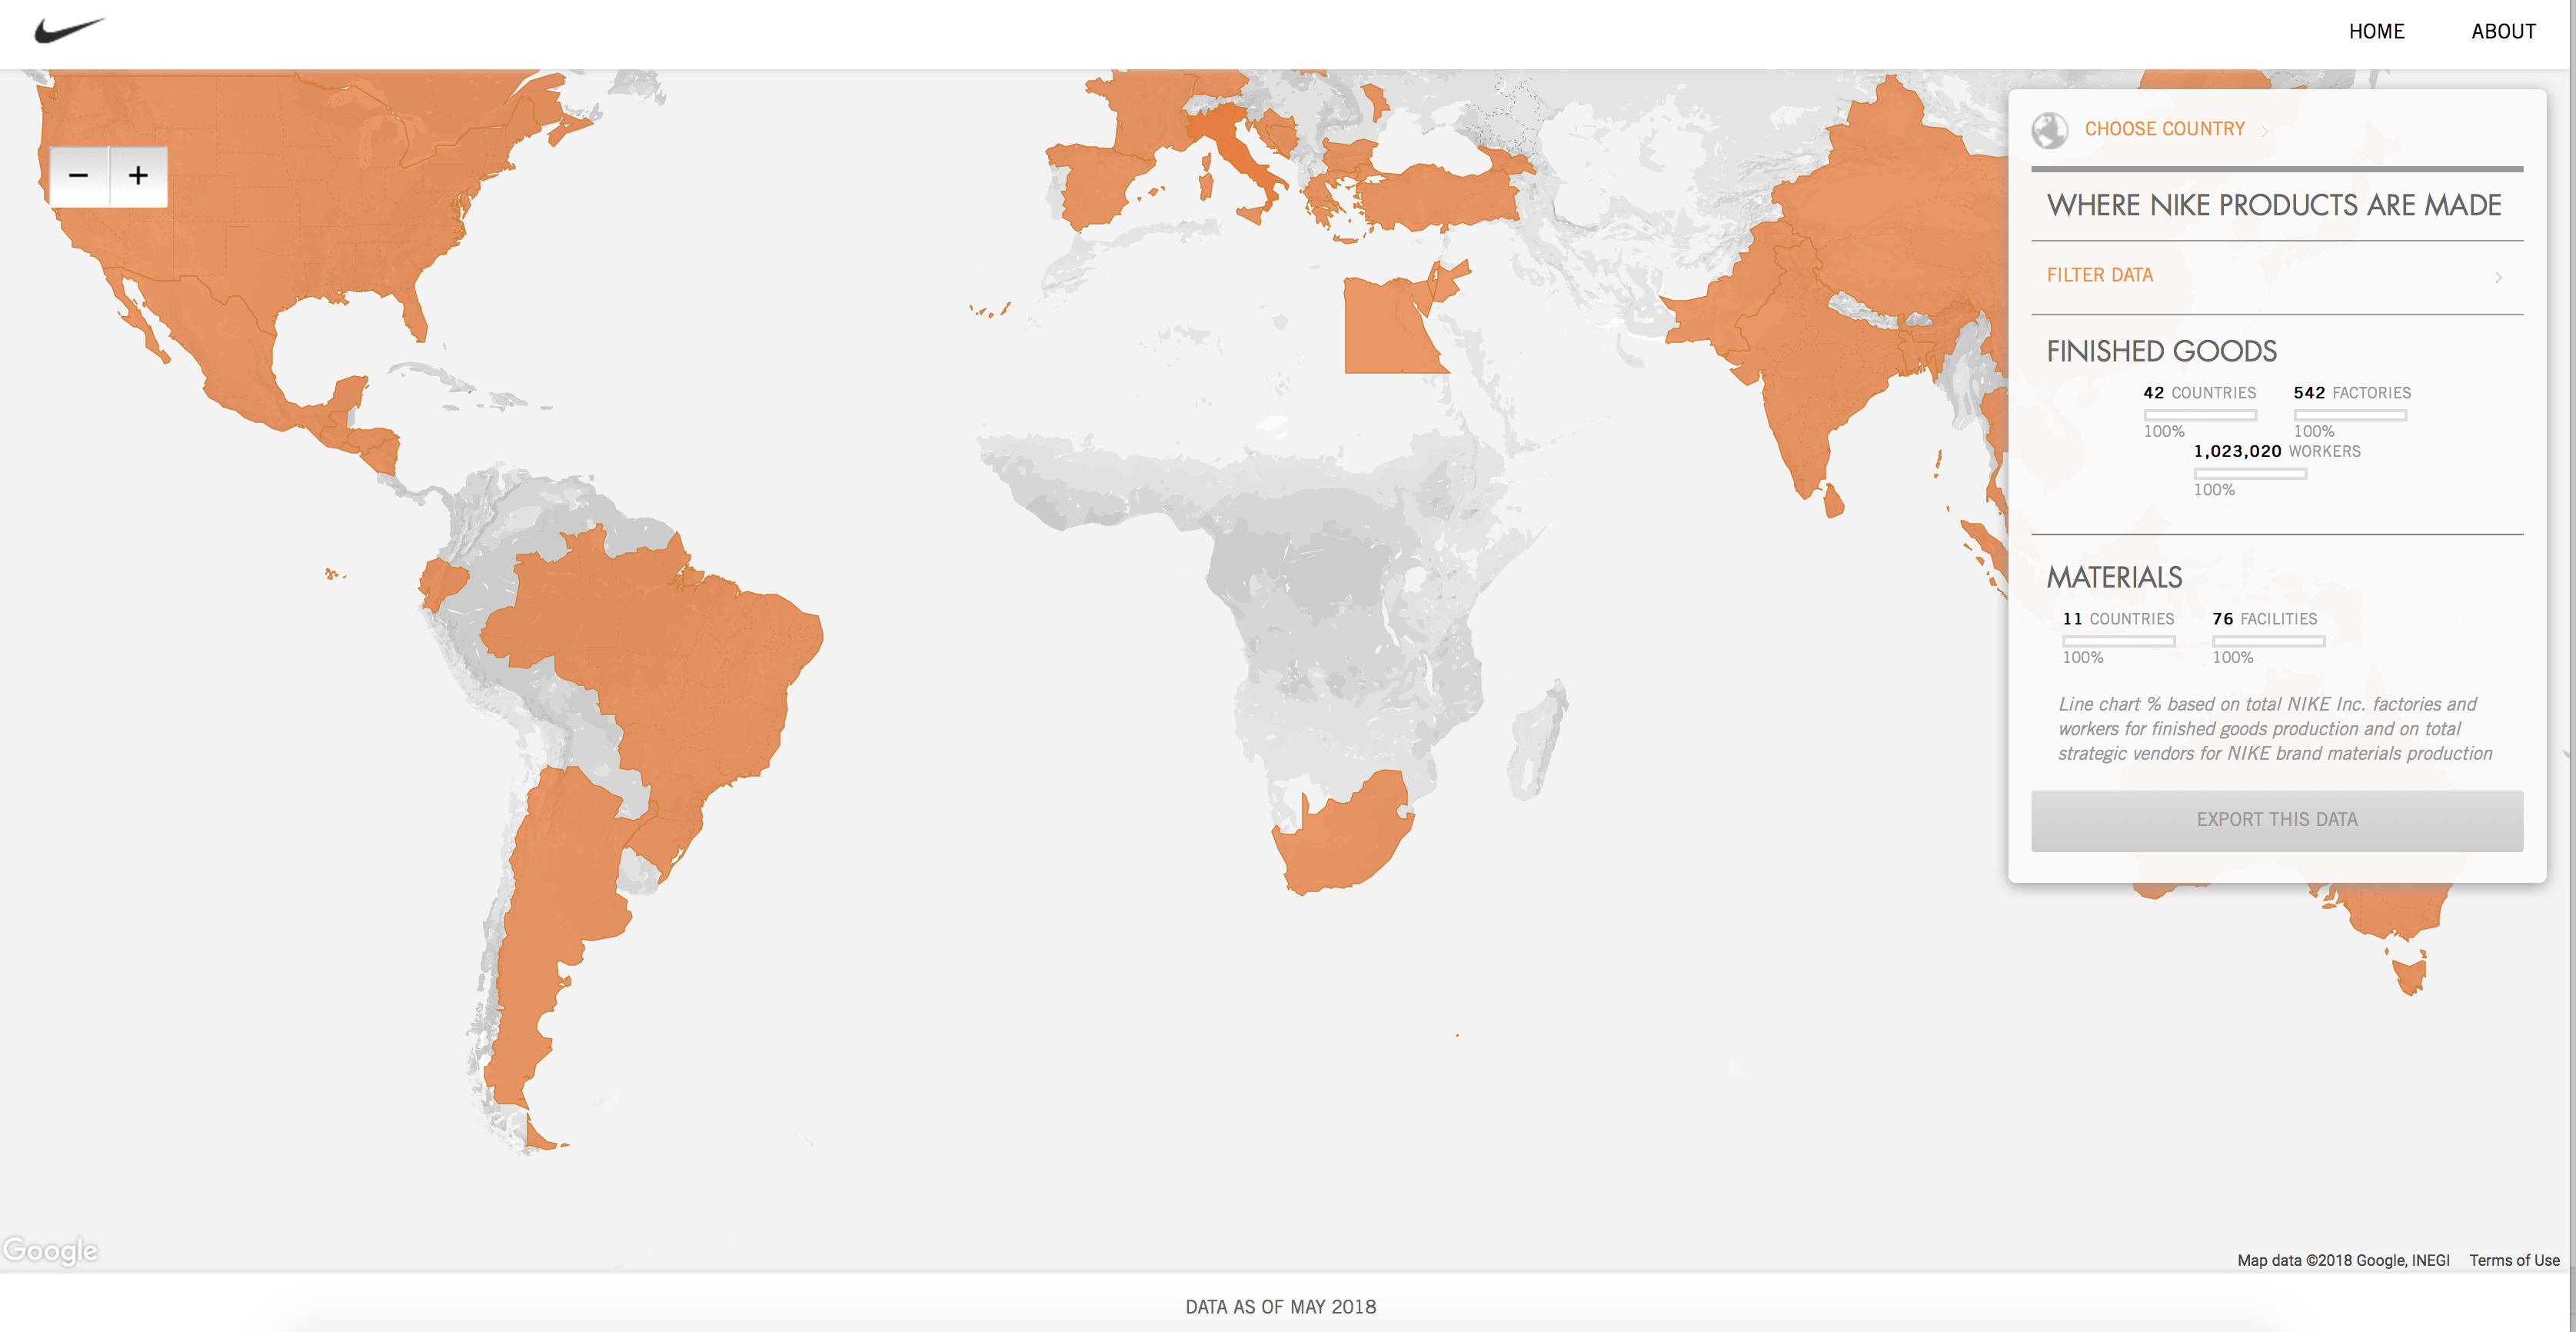
The original visualization
My goals with this visualization project:
My main goal with this project was to make it Explanatory. I set out to answer these questions with this project:
- Where does Nike have the most number of factories?
- Where does Nike employ the most number of workers?
I have seen (from the outside) a numbers of garment factories for international brands in India. They are typically multi-storied buildings with rows of tube lights visible through the open windows. I do not have data on how huge these factories are and how many people they employ. I have always wondered though.
Hence with this dataset I set out to calculate the number of workers per factory across all 42 countries in which Nike manufacturing facilities are set up.
The Makeover
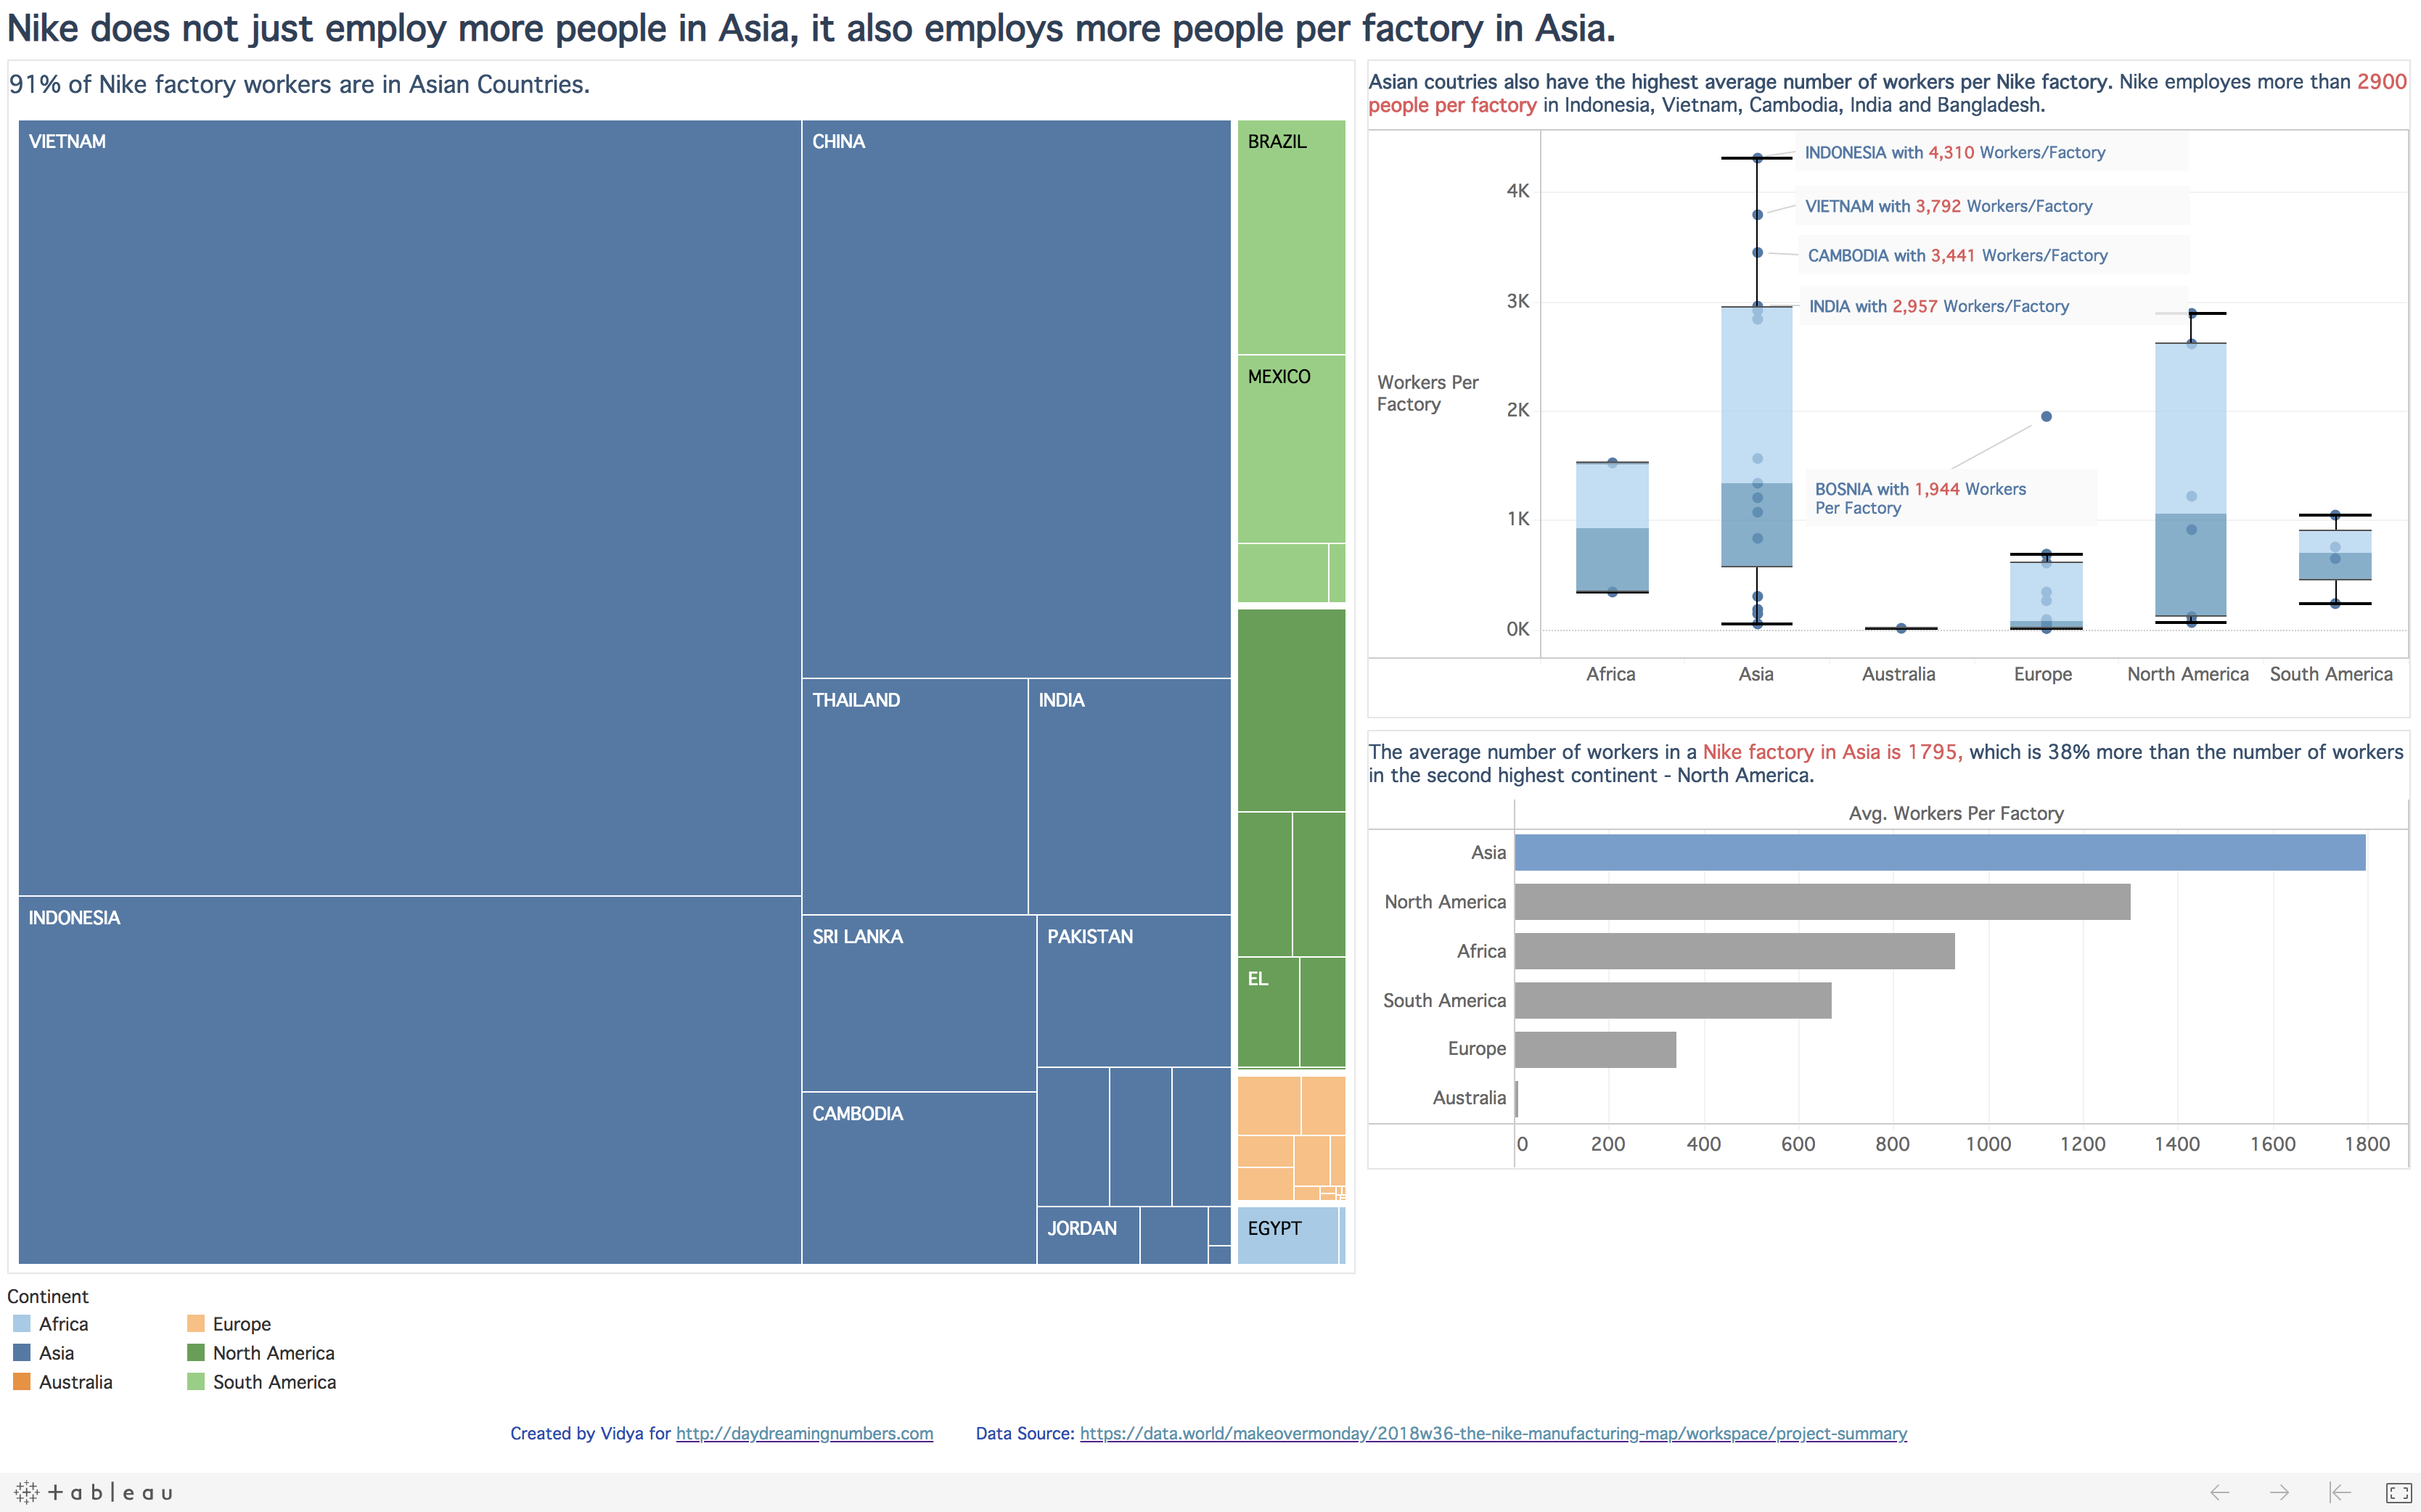
Here is an interactive version in Tableau.