A Complete Guide to Types of Data and Measurement Scales
Data is the backbone of business decisions, research and scientific discoveries. But not all data is made equal. Understanding data types and measurement scales is essential for collecting, analysing and interpreting data correctly.
Each type of data carries unique properties that dictate what analyses are valid, how results can be visualised and what conclusions can be drawn.
This article provides a comprehensive overview of the major data types (qualitative & quantitative) and the 4 measurement scales (nominal, ordinal, interval & ratio). By the end you’ll have a clear framework for identifying and interpreting data with confidence.
Data types
Data is broadly classified as
Qualitative or Categorical Data: Qualitative data characterises attributes and describes what quantitative values measure. They are generally expressed as words, labels or categories, though sometimes they can be coded numerically. They capture meaning and context and often require human judgement or text analytics.
Quantitative Data: Quantitative data measures or counts something and supports meaningful arithmetic or statistical analysis. They usually represent the values for how much, how many or how often.
Identifying data types – Example 1
Lets look at an example and try to identify Categorical and Quantitative Data.
| Department | Employees | Contractors |
| IT | 251 | 47 |
| HR | 22 | 5 |
| Sales | 25 | 178 |
| Total | 298 | 230 |
- IT, HR, Sales, Total belong to a category called Department. These are categorical data.
- Employees, Contractors belong to category which we could call types of workers. These are also categorical data.
- The numbers 251, 22, 25, 298, 47, 5, 178, 230 are quantitative data.
Common questions about the data types
- Are numbers always quantitative data? No. Numbers can also represent categorical data. An example is Year, say 2015, 2016, 2017. Another example is Employee ID say 1000, 1012, 1016, 1090. These represent categorical variables because though they take the form of numbers, they in fact describe something. They do not measure something.
A simple way to identify a quantitative variable is to ask the question: Does addition or subtraction of numbers make sense? If yes, the variable is quantitative, if no, the variable is categorical.
- Is categorical data always non-numerical? As we saw above, the answer is no, categorical data can sometimes be represented as numbers.
- Is quantitative data always numerical? Yes.
Identifying data types – Example 2
Lets look at one more example and try to identify the quantitative and categorical variables.
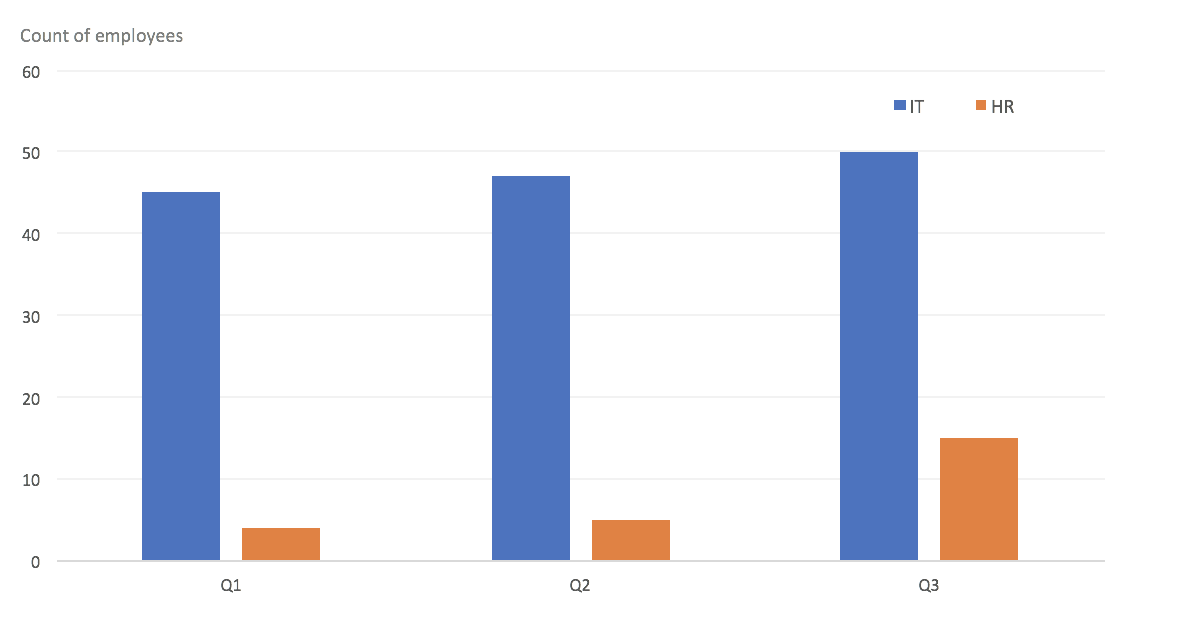
- x-axis: Q1, Q2, Q3 represent the quarters, hence categorical
- y-axis: Count of employees is quantitative
- Legend: IT, HR are categorical
- Bars: The height of the bars represent the count of employees and are quantitative. The colours represent IT and HR and is categorical. The bars are hence represent both quantitative and categorical variables.
Measurement Scales
Measurement scales determine how data can be validly analysed, interpreted and communicated. They define what the data means and what you can do with it. There are 4 types of measurement scales.
Nominal:
- Nominal data is “named” or “labelled” categorical data that can be divided into various groups without any inherent order.
- Data type: Categorical or Qualitative.
- Characteristics: Nominal data does not have an intrinsic order. Nominal data can be numbers. Example, postal or zip code is a nominal data.
- Mathematical Operations: Comparisons – equals and not equals – are possible. Ordinal data can be sorted.
- Statistical Measures: Median and Mode
- Examples: Gender, country, product type
Ordinal:
- Ordinal data is a categorical data type where variables have natural ordered categories. The distance between the categories is not consistent.
- Data type: Categorical or Qualitative.
- Characteristics: Ordinal data has a natural order. The distance between the ordered categories is not meaningful. It can sometimes be coded as numbers.
- Mathematical Operations: Addition, subtraction. In the absence of true zero, multiplication and division are meaningless. 20oC is not twice as hot as 10oC. 12 PM is not twice that of 6PM
- Statistical Measures:
- Examples: Likert scales, satisfaction levels
Interval:
- Interval data is a numeric data type in which we not only know the order of data but also the exact distance between them.
- Data type: Quantitative
- Characteristics: Interval data is ordered. Distance between data points is meaningful. There is no true zero. (True zero refers to the absence of what is being measured. In case of interval data like temperature, 0oC is not the absence of temperature)
- Mathematical Operations: Comparisons – equals and not equals – are the only mathematical operations on nominal data. Nominal data can be grouped. For example, all IT employees is a valid group.
- Statistical Measures: Mean, Median, Mode, Standard Deviation
- Examples: Temperature, Time, Date
Ratio:
- Ratio measures data using a numeric scale with equal intervals and a true zero point.
- Data type: Quantitative
- Characteristics: Interval data is ordered. Distance between data points is meaningful. There is a true zero.
- Mathematical Operations: Addition, Subtraction, Multiplication, Division
- Statistical Measures: Mean, Median, Mode, Standard Deviation
- Examples: Mass, Distance, Duration
Understanding data types and measurement scales is the first step toward making sense of your data. By mastering nominal, ordinal, interval, ratio scales and recognising the difference between qualitative and quantitative data, you’ll be equipped to choose the right analysis methods, avoid common pitfalls and communicate results clearly.