Less is more: Declutter your charts!
Removing unnecessary elements when communicating with charts can greatly impact the effect the chart has on your audience. If a chart appears complex, we assume it is hard to read.
Removing unnecessary elements when communicating with charts can greatly impact the effect the chart has on your audience. If a chart appears complex, we assume it is hard to read.
My aim with this makeover was to declutter the chart and show 3 pieces of information – installed capacity, investment and number of homes powered by Wind Energy.
Measures of variation describe the width of a distribution. They define how spread out the values are in a dataset. In this article, we will look at 4 measures of variation and when to use them.
The original shows 297 hours in executive time. I wanted to answer the question what percentage of each workday does Trump spend in executive time?

For this month’s SWDChallenge, Cole challenged us to visualize the variance in data. The mode, the median or the mean may not be a model that represents the entire dataset accurately. Hence it is important to visualize variance.
For this makeover, I wanted to bring in some context with population. Comparing China and US is not fair game. China’s population is at least 4 times that of US.
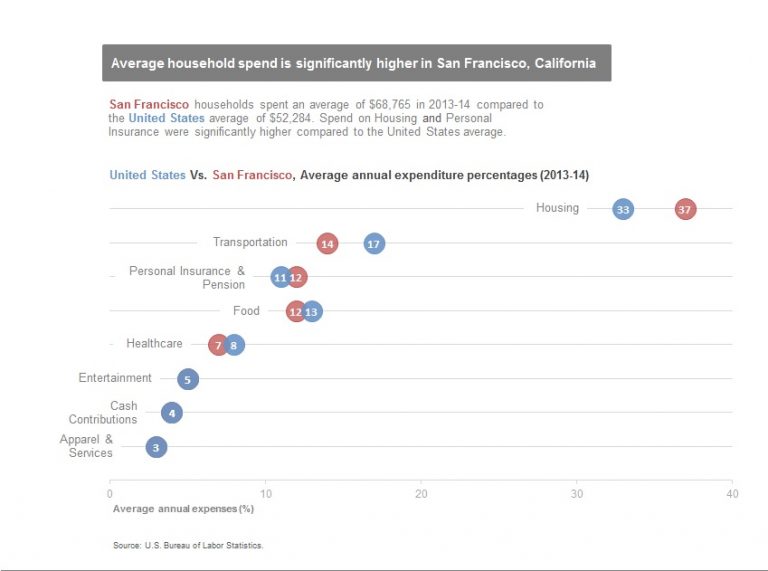
Dot plots use dots to represent the position of value on the axis. They are useful for comparisons and are a good replacement for bars or clustered bars.