Makeover Monday: How Chinese New Year compares with Thanksgiving
For this makeover, I wanted to bring in some context with population. Comparing China and US is not fair game. China’s population is at least 4 times that of US.

For this makeover, I wanted to bring in some context with population. Comparing China and US is not fair game. China’s population is at least 4 times that of US.
For this makeover, I used a dot plot to tell 2 stories. Which countries improved the most?Which countries have the highest and lowest DESI scores?
For this week’s makeover, I wanted to use Tableau. Sketching a few ideas for the visualization, I was drawn towards a heat map. I started with a heat map of days vs. hour of the day. Exploring the data further, I found the monthly variation to be interesting.
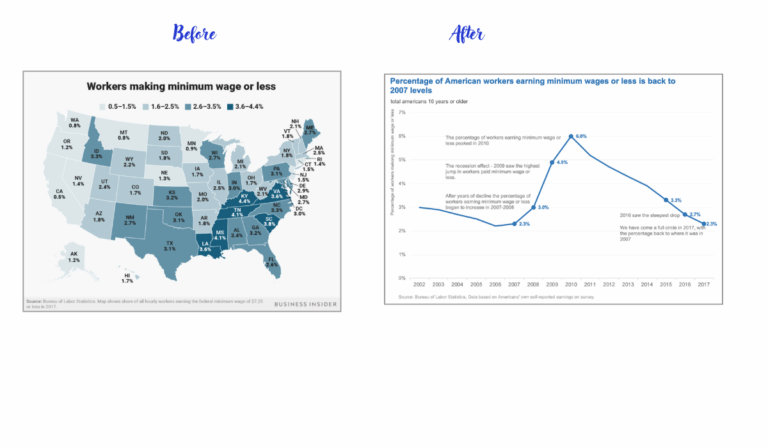
For this makeover, I wanted to practice annotations on charts. Annotations help our readers better understand the context and our argument with the graph. They can also help us highlight specific points and show readers what to focus on.

January 2019 SWDchallenge is all about going beyond our comfort zones – to make a visualization using a new tool. I make most of my visualizations using R, Excel or Tableau. For this challenge I decided to try Datawrapper. I am a huge fan of blog posts on Datawrapper. I have never used Datawrapper before,…
Original What works well? The map gives a good view of the state of global press freedom in 2017. The colors instantly show that most of Africa, South America, Eurasia and Asia do not have a free press. What does not work? The legend being an ordinal variable, a color saturation may worked better than…
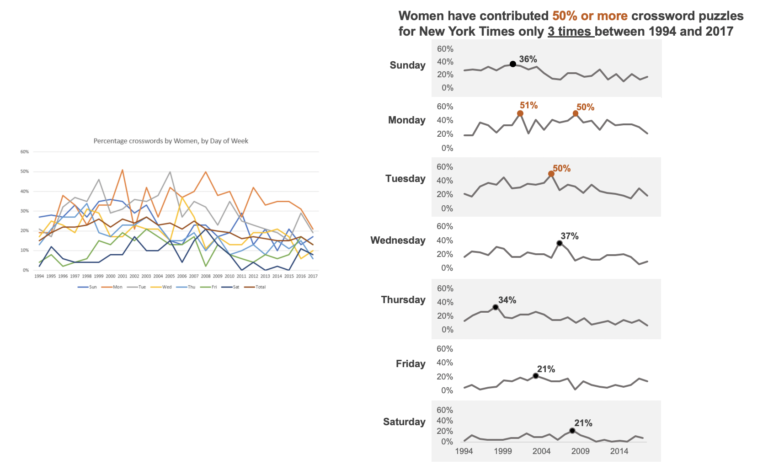
This week’s MakeOverMonday dataset comes from XWord Info. Here is the original graph What works well? The title is clear. The time is alone the X-axis, which is how we normally visualize time. What could be better? The 7 lines create a spaghetti effect. It is not easy to see the trend of a single…