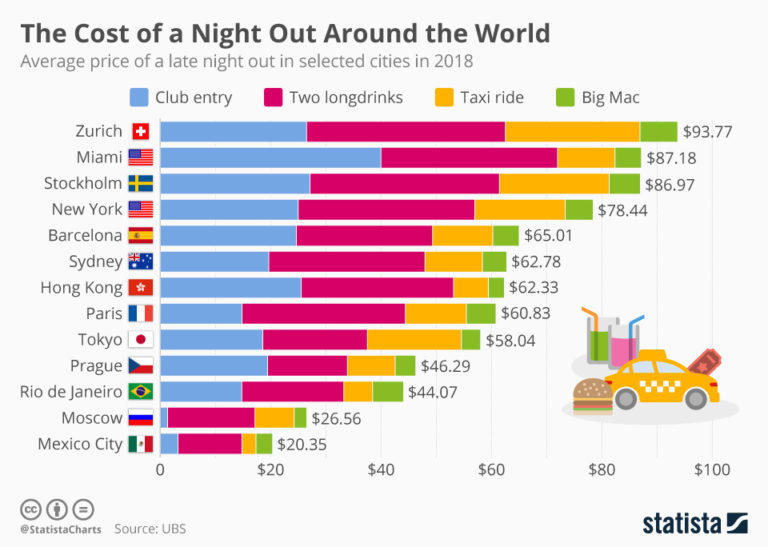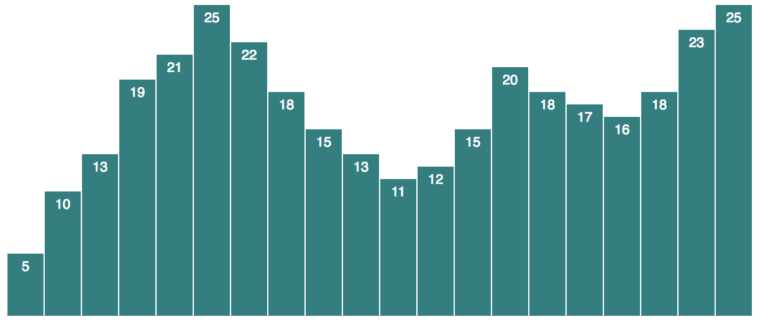
How to show time series data with incomplete period
One of the trickiest parts of working with time series data? Incomplete periods. Imagine tracking yearly revenue, quarterly sales, monthly website traffic, or weekly customer sign-ups, and the latest period isn’t finished yet. If you simply plot the data as is, the incomplete period can look like a sudden drop, misleading stakeholders and causing a lot of panic. If you omit the current data, you are missing valuable early signals and not showing the complete picture.