Bar Charts in D3.JS : a step-by-step guide

Let's learn how to create a bar chart in D3.js. To access the entire code for this tutorial, follow this link. First a few basic concepts. SVG: SVG stands for Scalable Vector Graphics and is commonly used to display a variety of graphics on the web. SVG is nothing more than simple text files that…

0 Comments

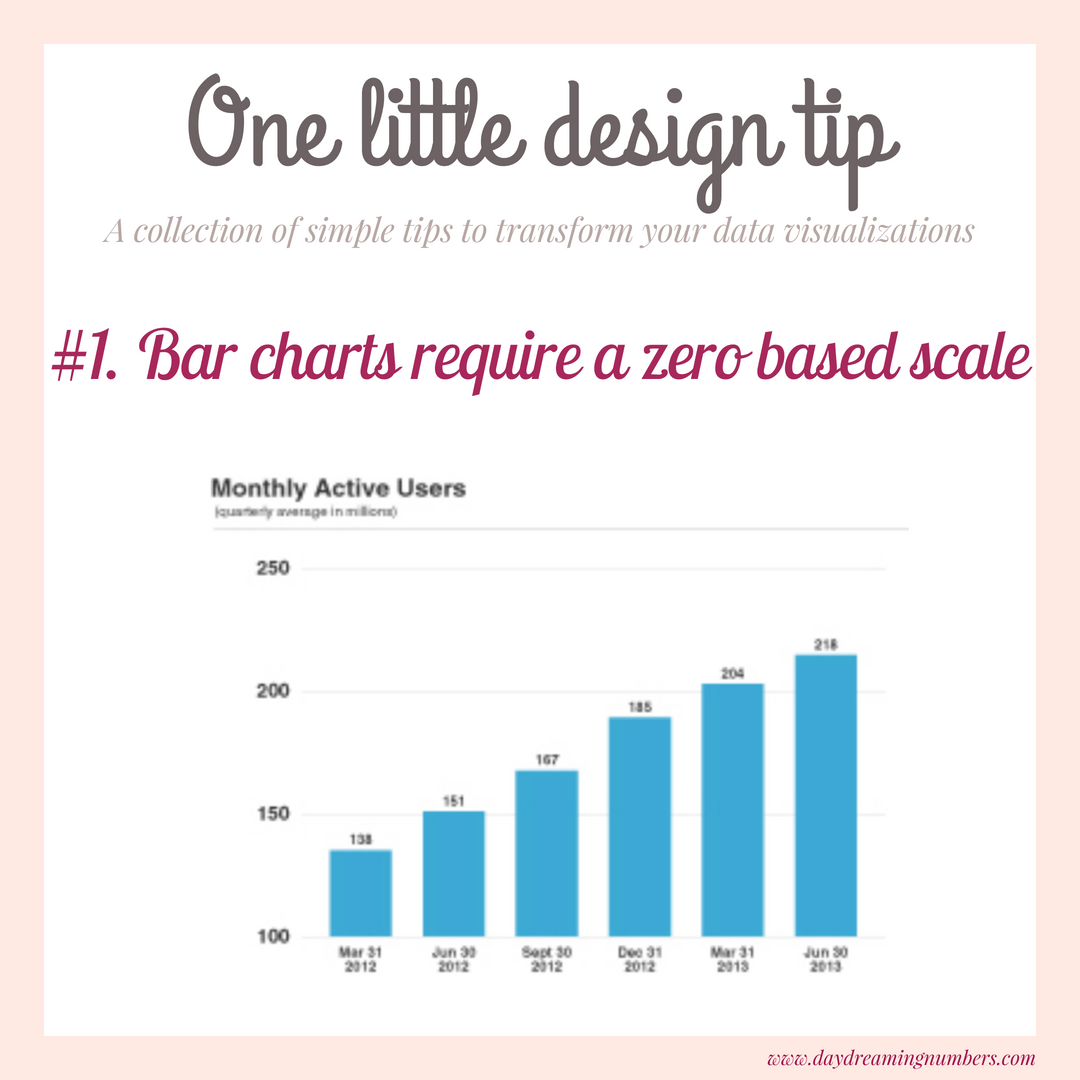
#1. Bar charts require a zero based scale

This series is a collection of small changes in data visualization that make a big difference to the end result. When using bar charts, the axis needs to start at zero. Why? Its simpler to understand this if we start with an example. This chart below was used by Twitter in its IPO filing. What do you…

0 Comments

Reframe for clarity

As data viz creators, we are in a constant battle between the multiple ways in which we can present our data to an audience. Which is the best way to present the data? It depends. There is no one best way. But a good practice to follow is to choose one with clarity. Let me…

0 Comments
Read more about the article Comparing change through time
time-for-a-change

Comparing change through time

A clustered bar chart is one of the most commonly used representations to compare change through time. A clustered bar chart, though a good option to compare values, does not represent the change through time effectively. Here is some data on which technology products consumers intend to buy in 2016 and how it compares against…

0 Comments
Read more about the article Horizontal and vertical bullet charts in excel
BulletChartsInExcel

Horizontal and vertical bullet charts in excel

Bullet Charts were developed by Stephen Few to replace the meters and gauges that are often used in business dashboards. Here is one such dashboard from Oracle BI Discoverer tool. The idea of gauges and meters is borrowed from an automobile dashboard where they are used to display data in a small amount of space.…

0 Comments
Read more about the article Signifiers in Data Visualization    
Signifiers In Visualization

Signifiers in Data Visualization    

I was introduced to the concept of signifiers and affordances by Don Norman’s book, “The Design of Everyday Things”. Though this post is about signifiers, it is important to start with affordances as they go hand-in-hand. What are affordances? The term affordance was coined by James Gibson (1977, 1978) and concept originates from ecological psychology.…

2 Comments
Read more about the article The one advice I would give my last year self
OneAdvice

The one advice I would give my last year self

If there is one advice I could give my last year self, it would be to stop running behind learning new tools. Don’t get me wrong, tools are very useful in every realm we use them in. The problem begins when we skip learning concepts and jump directly to learning tools. Allow me to explain…

0 Comments