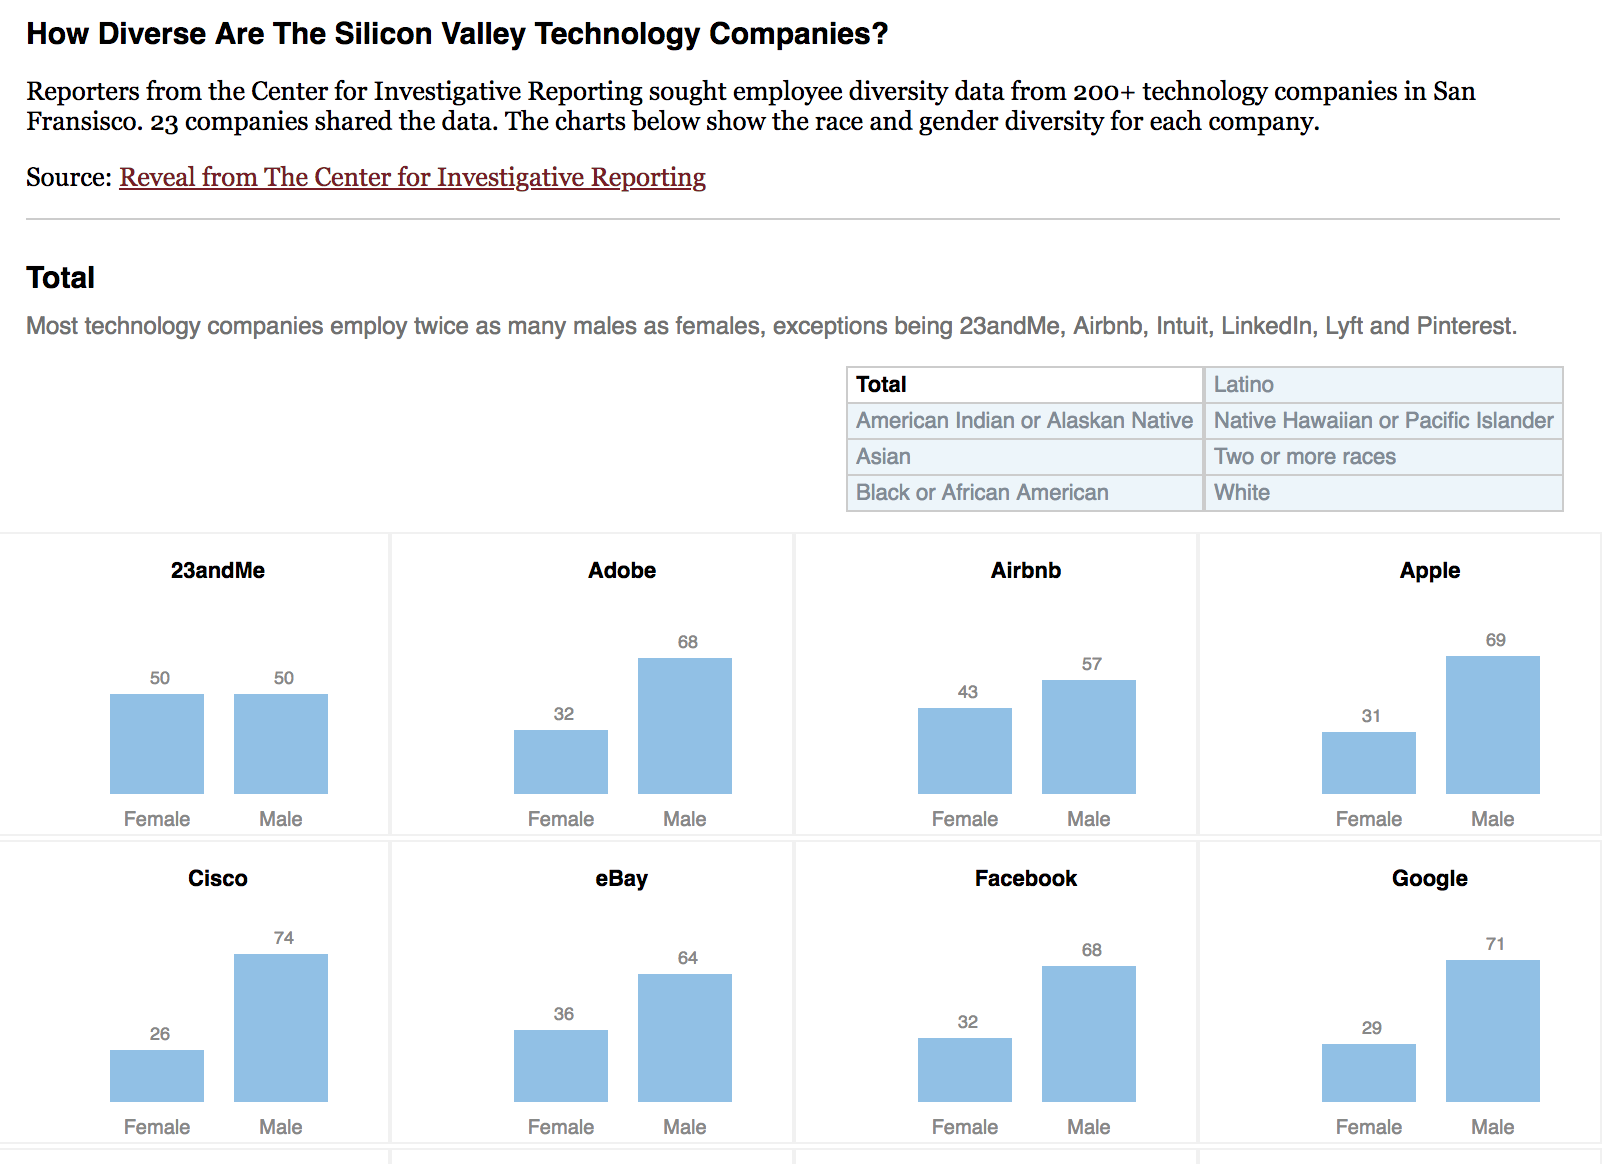
How diverse are the Silicon Valley Technology Companies?
Reporters from the Center for Investigative Reporting sought employee diversity data from 211 technology companies in San Fransisco. A couple of dozen companies shared their data. Here is a visualization of how race and gender diversity for 23 companies in Silicon Valley. The data was analysed using R and the visualization is using d3.js.
0 Comments
July 23, 2018
